

Question: Here is what I need you to submit. Type a report that includes the following: 1. An introduction that gives an overview of this Investigation.
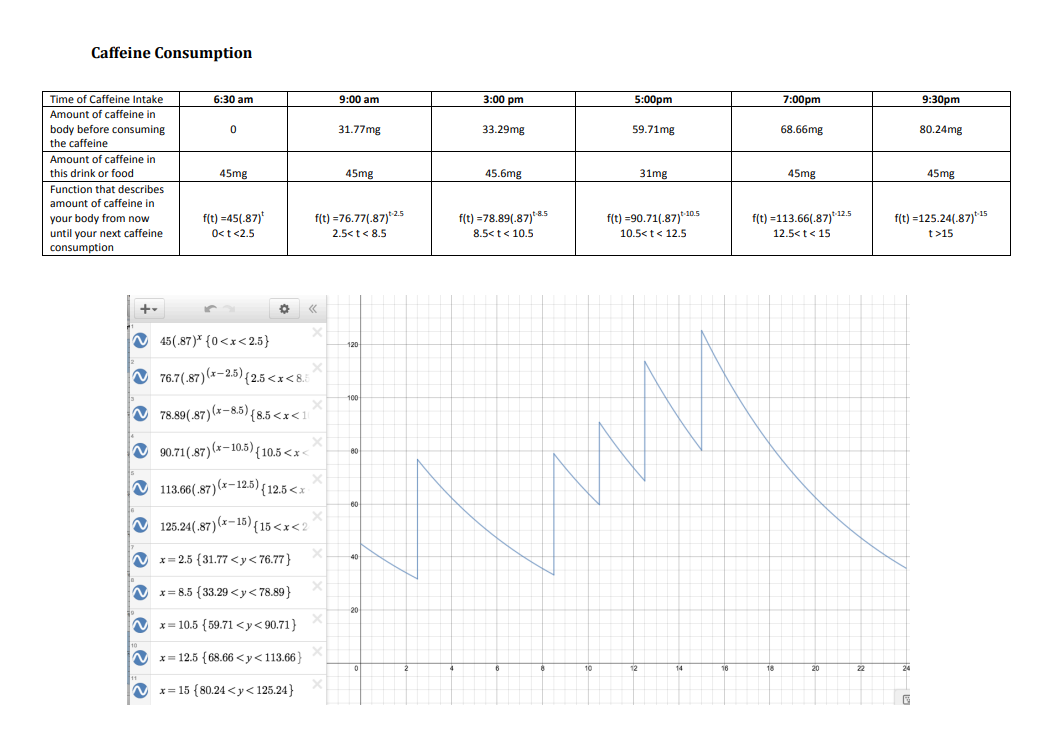


Here is what I need you to submit. Type a report that includes the following: 1. An introduction that gives an overview of this Investigation. 2. Answers to all the questions for You Try It 1 - I". - Include any tables that you were asked to make. - Include all required graphs in the document. - Make graphs using Desmos twwwdesmoscom}. 3. Discussion: Post yourYou Try It #4 table and graph in the Investigation 2 Discussion forum. Reply to two other students. In your replies you can: - Ask students clarication questions - Share methods and strategies for making the graph and help each other with the process - Compare your caffeine consumption with that of your group members 4. Write a conclusion paragraph reecting on the work you didr the math you used and your opinion of the investigation and the results that you got. Submit one le in pdf format by clicking Submit and uploading your le. Here is a sample of a table used to track caffeine consumption over a 24 hour period and the functions and graph that models the caffeine consumption: Caffeine Consumptiont Caffeine Consumption Time of Caffeine Intake 6:30 am 9:00 am 3:00 pm 5:00pm 7:00pm 9:30pm Amount of caffeine in body before consuming 31.77mg 33.29mg 59.71mg 68.66mg 80.24mg the caffeine Amount of caffeine in this drink or food 45me 45mg 45.6mg 31mg 45mg 45mg Function that descri amount of caffeine in your body from now f(t) =45(.87)* f[t) =76.77(.87)t-2.5 f(t) =78.89(.87).as f(t) =90.71(.87)t-105 f(t) =113.66(.87)1-12.5 f(t) =125.24(.87)+-15 until your next caffeine Oct 15 mption + . N X 45(.87)" (0
Step by Step Solution
There are 3 Steps involved in it

Get step-by-step solutions from verified subject matter experts