

Question: Here, we first grouped the data by origin and then calculated the summary statistics. Calculate the median and interquartile range for arr _ delay s
Here, we first grouped the data by origin and then calculated the summary statistics.
Calculate the median and interquartile range for arrdelay s of flights in in the sfofebflights data frame, grouped by carrier. Which carrier has the most variable arrival delays?
Departure delys by month
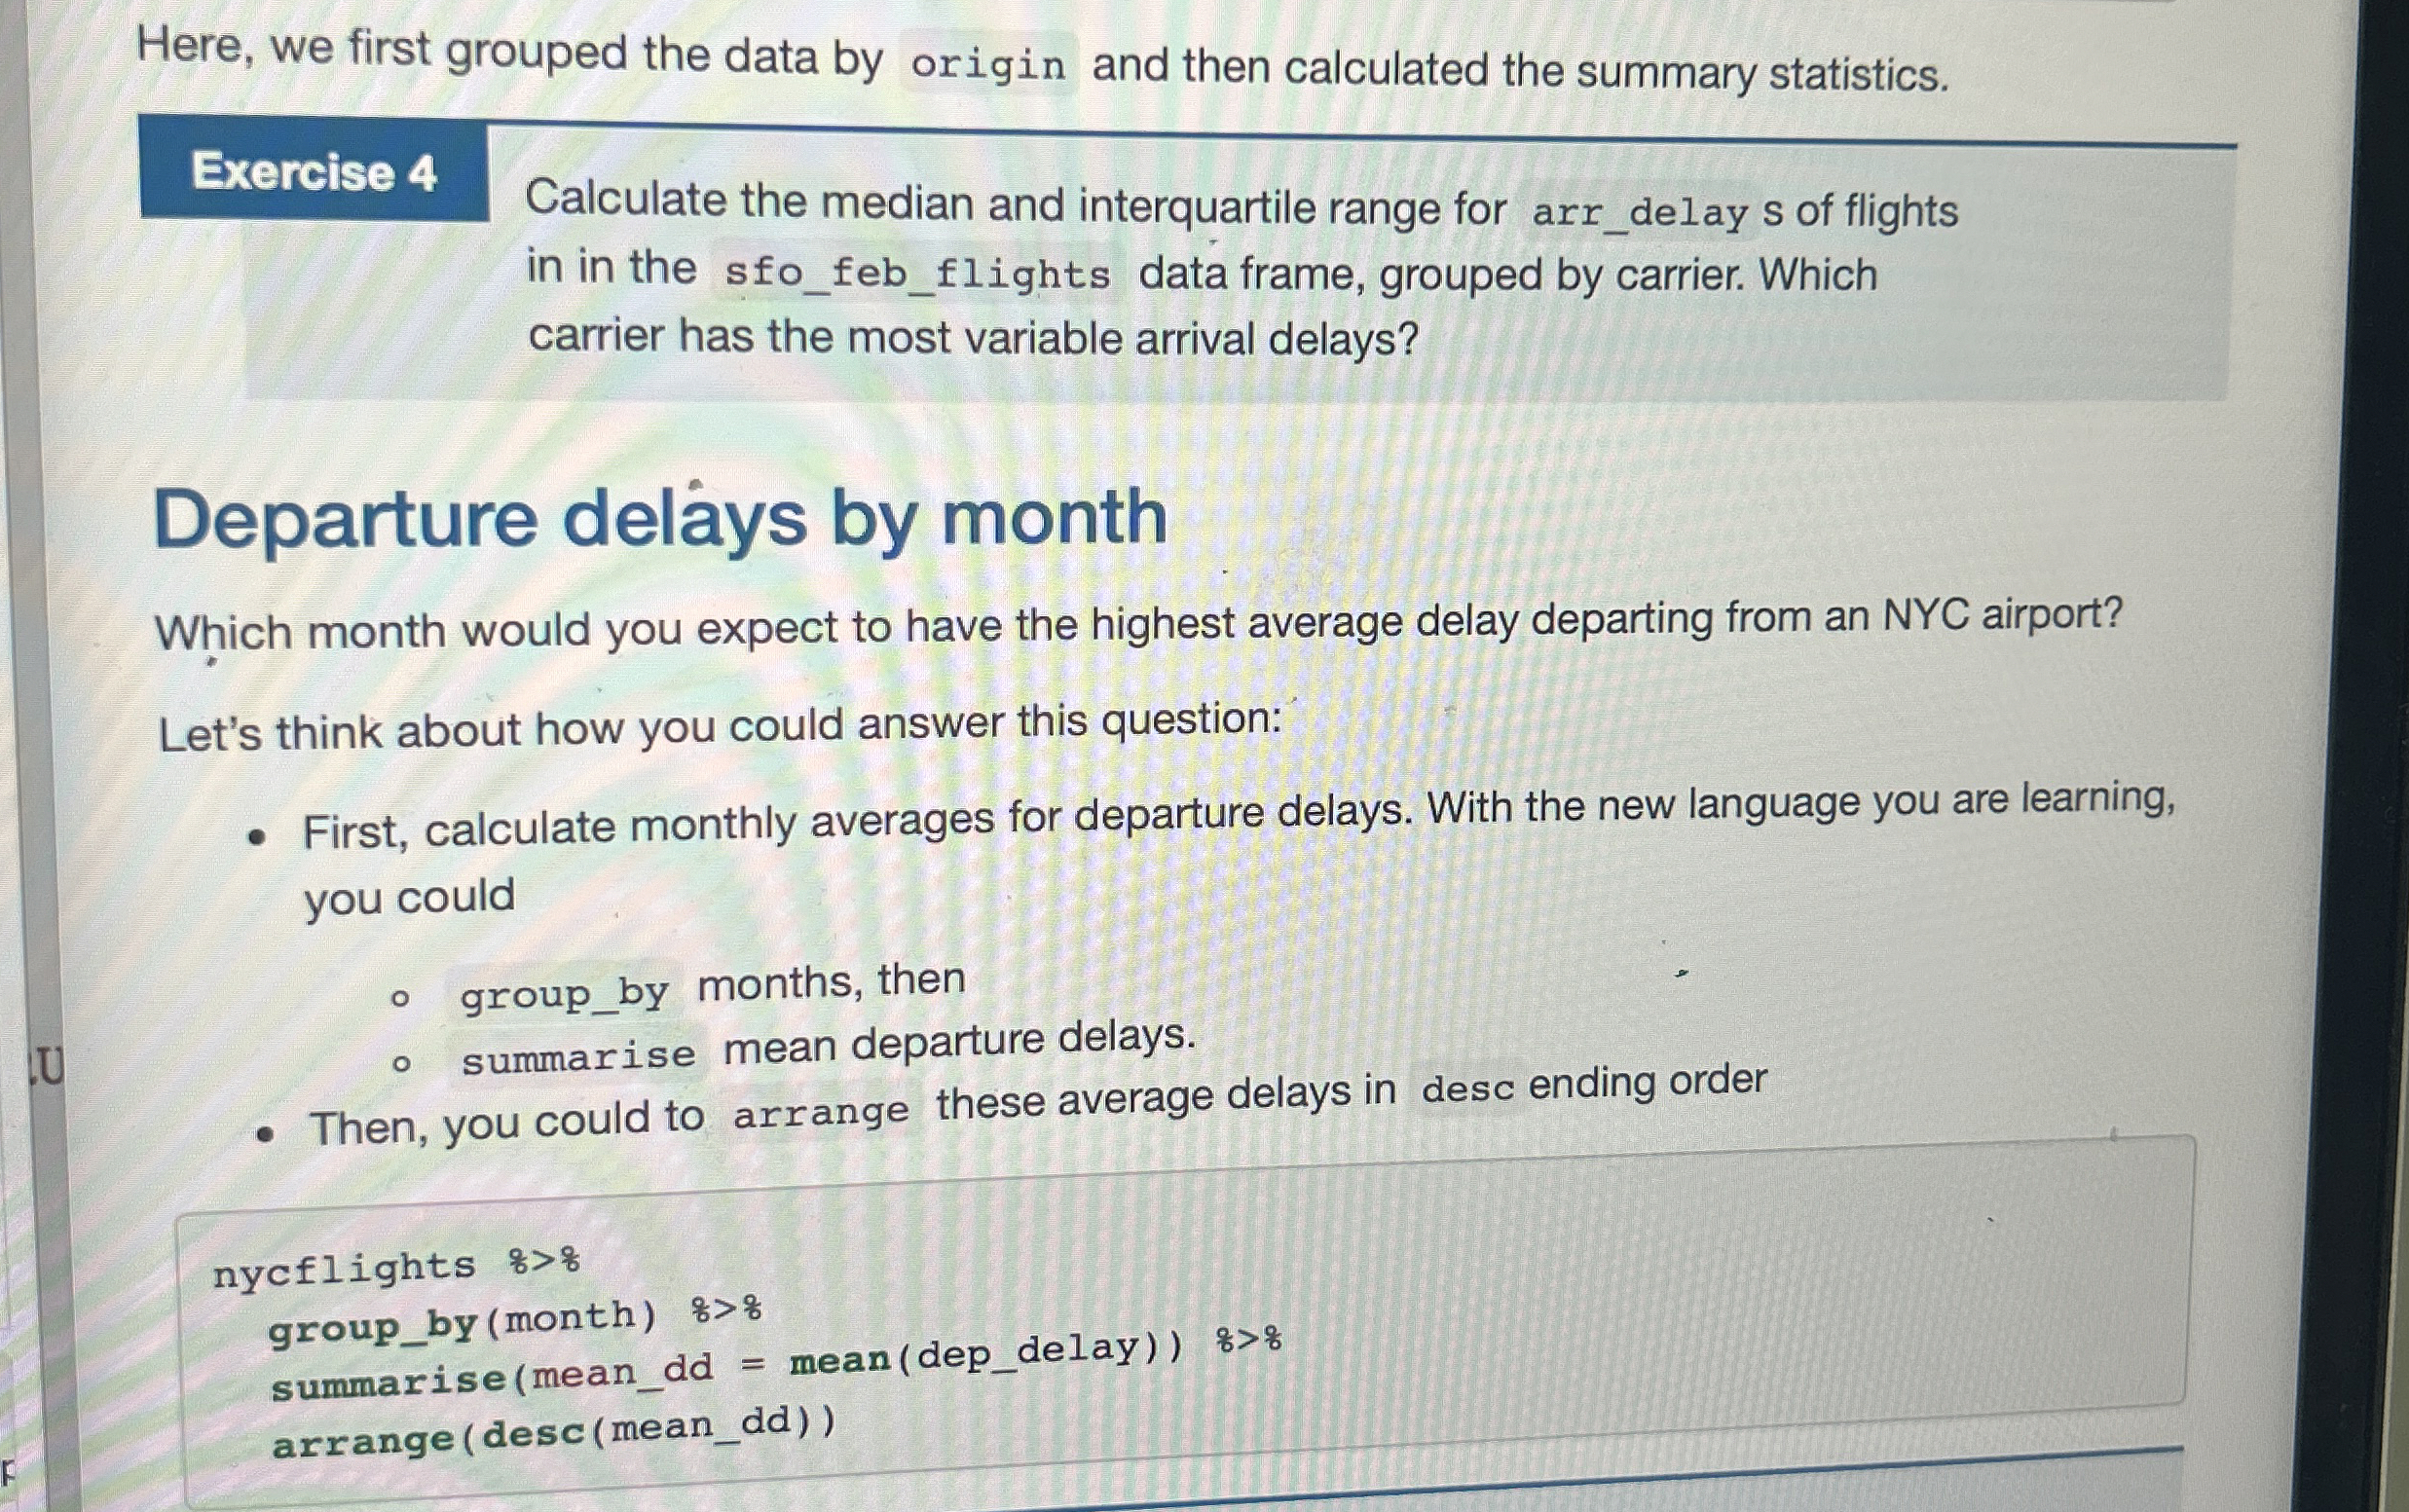
Which month would you expect to have the highest average delay departing from an NYC airport?
Let's think about how you could answer this question:
First, calculate monthly averages for departure delays. With the new language you are learning, you could
groupby months, then
summarise mean departure delays.
Then, you could to arrange these average delays in desc ending order
Step by Step Solution
There are 3 Steps involved in it
1 Expert Approved Answer
Step: 1 Unlock

Question Has Been Solved by an Expert!
Get step-by-step solutions from verified subject matter experts
Step: 2 Unlock
Step: 3 Unlock