

Question: here's a screenshot! 3. Below is a table partially reconstructed from results of a recent Gallup poll of 18-to-26 year olds. Year Number Uninsured Number
here's a screenshot!
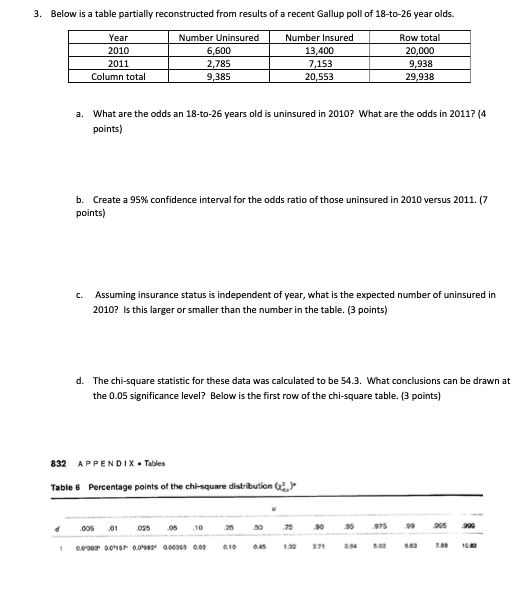
3. Below is a table partially reconstructed from results of a recent Gallup poll of 18-to-26 year olds. Year Number Uninsured Number Insured Row total 1010 6,600 13,400 20,000 2011 2,785 7,153 9,938 Column total 9,385 20,553 29,938 a. What are the odds an 18-to-26 years old is uninsured in 2010? What are the odds in 2011? (4 points) b. Create a 95% confidence interval for the odds ratio of those uninsured in 2010 versus 2011. (7 points) C. Assuming insurance status is independent of year, what is the expected number of uninsured in 2010? Is this larger or smaller than the number in the table. (3 points) d. The chi-square statistic for these data was calculated to be 54.3. What conclusions can be drawn at the 0.05 significance level? Below is the first row of the chi-square table. (3 points] 832 APPENDIX . Tables Table 6 Percentage points of the chi-square distribution (!. ) 005 .01 05 .10 50 79 1 010
Step by Step Solution
There are 3 Steps involved in it

Get step-by-step solutions from verified subject matter experts