

Question: Here's a statistics question that i need help with ASAP Second scenario: The following table represents the annual production volume and the ending inventory to
Here's a statistics question that i need help with ASAP
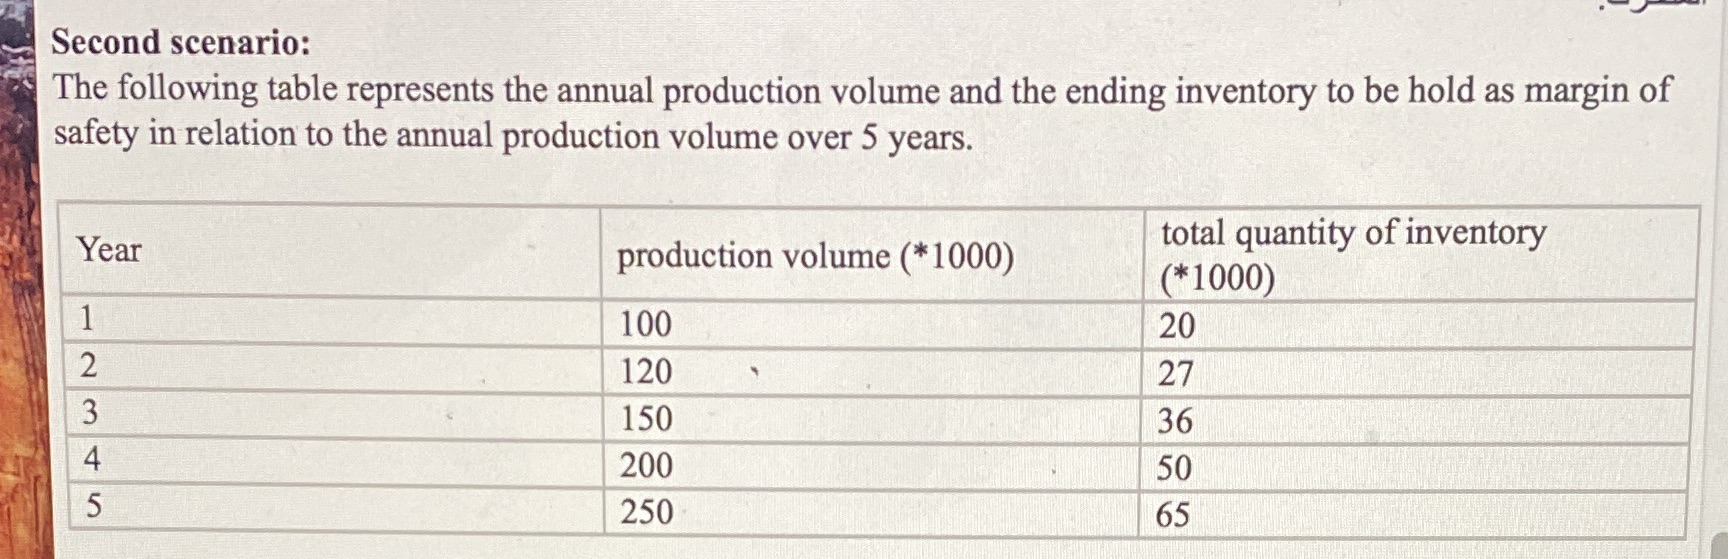
Second scenario: The following table represents the annual production volume and the ending inventory to be hold as margin of safety in relation to the annual production volume over 5 years. Year production volume (*1000) total quantity of inventory (*1000) 100 20 N 120 27 150 36 A 200 50 u 250 65
Step by Step Solution
There are 3 Steps involved in it
1 Expert Approved Answer
Step: 1 Unlock

Question Has Been Solved by an Expert!
Get step-by-step solutions from verified subject matter experts
Step: 2 Unlock
Step: 3 Unlock