

Question: Here's the code I ' m trying to set for an R project. These are the directions: Twelve E . coli populations are cultivated in
Here's the code Im trying to set for an R project.
These are the directions:
Twelve E coli populations are cultivated in parallel in a reduced glucose medium that also contains citrate since Important is that only glucose can be used as carbon source under the experimental conditions. After many thousands of generations, scientists of the Lenski lab found that one population can suddenly metabolize citrate due to a mutations see attached paper Your assignment is now to analyze an additional data set that they generated and published I will distribute the paper after you all submitted your assignments.
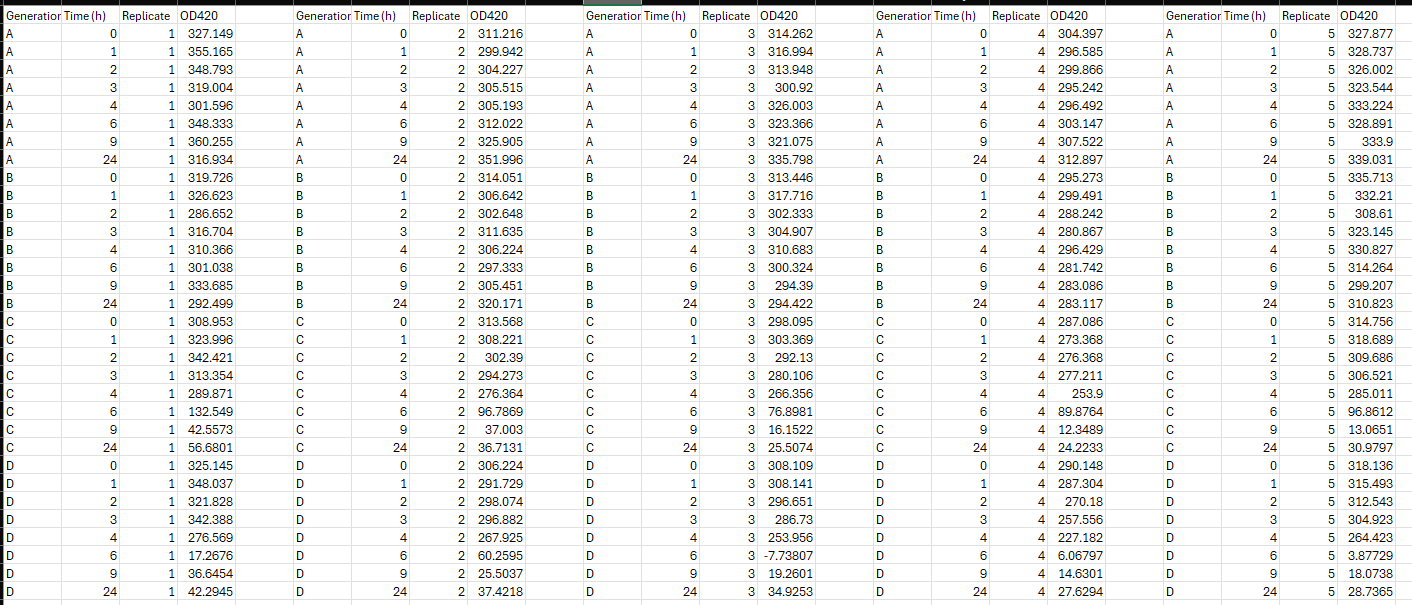
The data table shows changes of the citrate concentrations in the culture medium of different E coli populations ABCD during a h window. Samples are taken at time point: The scientist repeated the experiment times replicates. They measured the changes in the citrate concentration as changes of ODOptical Density at nm The E coli population AD represent different generations of the population that developed the mutationmutations to metabolize citrate.: A ; B; C; D generations from start.
Your assignment:
Write an R program to analyze the data: calculate the mean plus standard deviation for each data point, plot the data with time hours on the xaxis and citrate concentration OD on the yaxis. Submit your R script. You may need to reorganize the spreadsheet and remember to read the data into a variable
Attached to this is an image of the data and below is my code.
setwdC:UsersDrakeDownloads # Install required packages if not already installed if requireNamespacereadr quietly TRUE install.packagesreadr if requireNamespacedplyr quietly TRUE install.packagesdplyr if requireNamespaceggplot quietly TRUE install.packagesggplot if requireNamespacetidyr quietly TRUE install.packagestidyr # Load libraries libraryreadr librarydplyr libraryggplot librarytidyr data read.tablefile'DataCitrateconcentrations.csv headerTRUE, sep headdata datalong data pivotlongercols Time, namesto "Population", valuesto OD summarystats datalong groupbyTime Population summarise meanOD meanOD narm TRUE sdOD sdOD narm TRUEgroups 'drop' printsummarystats plot ggplotsummarystats, aesx Time, y meanOD color Population geomlinesize geompointsize geomerrorbaraesymin meanOD sdOD ymax meanOD sdOD width labs title "Citrate Concentration Over Time", x "Time hours y "Citrate Concentration OD color "Population" thememinimal themetext elementtextsize ggsavecitrateconcentrationplot.png plot
Below are my errors:
Workspace loaded from ~RData libraryggplot librarytidyr data read.tablefile'DataCitrateconcentrations.csv headerTRUE, sep Error in filefilert : cannot open the connection In addition: Warning message: In filefilert : cannot open file 'DataCitrateconcentrations.csv: No such file or directory headdata function list character package NULL, lib.loc NULL, verbose getOptionverbose envir GlobalEnv, overwrite TRUE fileExt functionx db greplgzbzxz$ x ans sub x datalong data pivotlongercols Time, namesto "Population", valuesto OD Error in UseMethodpivotlonger" : no applicable method for 'pivotlonger' applied to an object of class "function" summarystats datalong groupbyTime Population summarise meanOD meanOD narm TRUE sdOD sdOD narm TRUEgroups 'drop' Error in summarise meanOD meanOD narm TRUE sdOD sdOD : could not find function "summarise" printsummarystats Error: object 'summarystats' not found plot ggplotsummarystats, aesx Time, y meanOD color Population geomlinesize geompointsize geomerrorbaraesymin meanOD sdOD ymax meanOD sdOD width labs title "Citrate Concentration Over Time", x "Time hours y "Citrate Concentration OD color "Population" thememinimal themetext elementtextsize Error: object 'summarystats' not found ggsavecitrateconcentrationplot.png plot Saving x in image Error in x$theme : object of type 'closure' is not subsettable
I would appreciate the assistance
Step by Step Solution
There are 3 Steps involved in it
1 Expert Approved Answer
Step: 1 Unlock

Question Has Been Solved by an Expert!
Get step-by-step solutions from verified subject matter experts
Step: 2 Unlock
Step: 3 Unlock