

Question: heres the data with it. work on excel please Variance and standard deviation. Calculate the variance and the standard deviation of U.S. Treasury bills, long-term
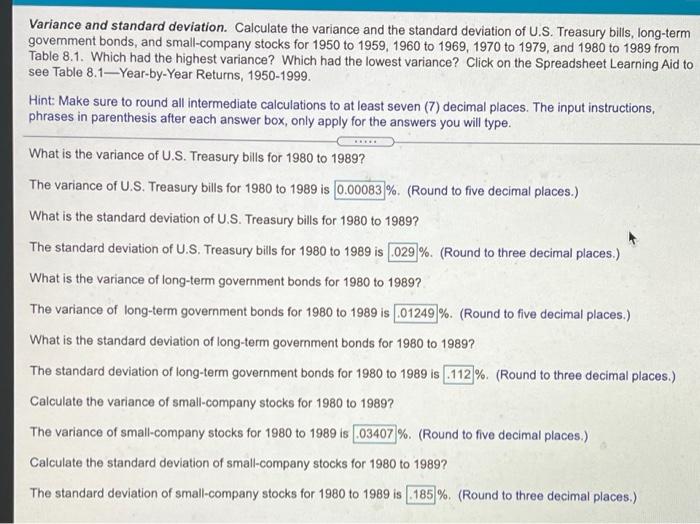
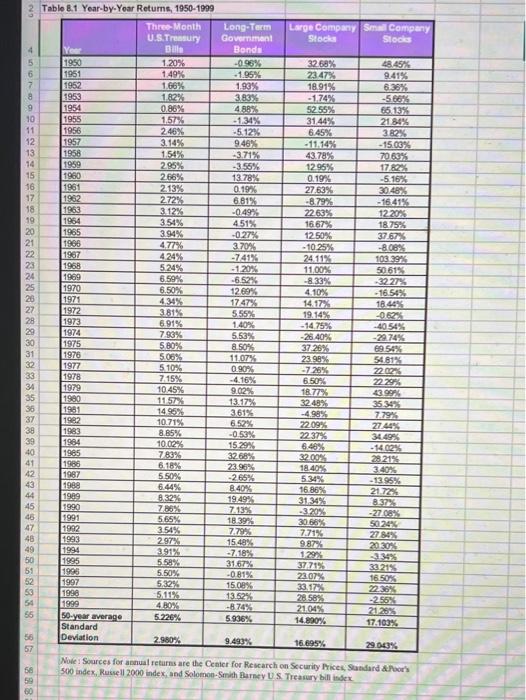
Variance and standard deviation. Calculate the variance and the standard deviation of U.S. Treasury bills, long-term government bonds, and small-company stocks for 1950 to 1959, 1960 to 1969, 1970 to 1979, and 1980 to 1989 from Table 8.1. Which had the highest variance? Which had the lowest variance? Click on the Spreadsheet Learning Aid to see Table 8.1-Year-by-Year Returns, 1950-1999. Hint: Make sure to round all intermediate calculations to at least seven (7) decimal places. The input instructions, phrases in parenthesis after each answer box, only apply for the answers you will type. What is the variance of U.S. Treasury bills for 1980 to 1989? The variance of U.S. Treasury bills for 1980 to 1989 is 0.00083 %. (Round to five decimal places.) What is the standard deviation of U.S. Treasury bills for 1980 to 1989? The standard deviation of U.S. Treasury bills for 1980 to 1989 is .029%. (Round to three decimal places.) What is the variance of long-term government bonds for 1980 to 1989? The variance of long-term government bonds for 1980 to 1989 is .01249%. (Round to five decimal places.) What is the standard deviation of long-term government bonds for 1980 to 1989? The standard deviation of long-term government bonds for 1980 to 1989 is .112 %. (Round to three decimal places.) Calculate the variance of small-company stocks for 1980 to 1989? The variance of small-company stocks for 1980 to 1989 is 03407%. (Round to five decimal places.) Calculate the standard deviation of small-company stocks for 1980 to 1989? The standard deviation of small-company stocks for 1980 to 1989 is 185%. (Round to three decimal places.) GN Table 8.1 Year-by-Yoar Returns, 1950-1999 Three Month Long-Term Large Company Small Company U.S.Treury Government Stocks Stock Yeer BU Bonds 5 1950 1.20% -0.95% 32.6% 48.45% 6 1951 1.49% 23.47% 9.41% 7 1952 1.66% 1.93% 18.91% 6.35% 1953 1.82% 3,83% -1.74% 9 1954 0.86% 4889 52.55% 5513% 10 1955 1.57% -1.34% 31 44% 21.84% 11 1956 246% -5.12% 6.45% 382% 12 1957 3.14% 9.46 -11.14% -15.00% 13 1958 -3.71% 43.78% 70.63% 14 1959 2.95% -3.55% 12.95% 17.82% 15 1980 266% 13.78% 0.19% -5.16% 16 1961 213% 0.19% 27.63% 30.48% 17 1962 272% 6 81% -8.79% - 16.41% 18 1963 3.12% -0.49% 22.63% 12 20% 19 1964 354% 451% 16.67% 18.75% 20 1965 3 94% -0.27% 1250% 37 67% 21 1996 4.77% 3.70% -10.25% -8.0895 22 1967 4 24% 24.11% 103.39% 23 1968 5.24% -1 20% 11.00% 50619 24 1989 6.59% -6.52% -8.33% 3227% 1970 6.50% 12 69% 4 10% - 16.54% 26 1971 1747% 14.17% 18 469 27 1972 3.81% 5.55% 19.14% 082 28 1973 6 91% 1.409 .14 75% -4054% 29 1974 7.93% 5.53% -25.40 -22.74% 30 1975 5 80% 8.50% 37.26% 9 542 31 1976 5.05% 11.07% 23.98% 54.81% 32 1977 5 10% 0.90% -7.26% 2207 33 1978 715% -4.16% 6.50% 22.29% 34 1979 10 45% 9.02% 18 77% 43 99% 35 1980 13.17% 3249% 35 345 36 1981 14.95% 361% 7.79% 37 1.982 10.71% 6.52% 2209% 27.44% 39 1983 8.85% -0.53% 22.37% 34.49% 39 1984 10.02% 15.29% 6.48% 40 1985 783% 3268% 32.00% 28 21% 41 1986 6.18% 23.96%% 18.40% 340% 42 1987 5.50% -265% 5.34% - 13.95% 43 1989 644% 8.401 16. 86% 21.72% 44 1989 8.32% 194995 31.34% 8.37% 45 1990 7/1995 -3.20% 45 1991 5.65% 18.39% 30.66% 5024 47 1992 3.54% 7.79% 7.71% 27 86% 48 1943 2.97% 154" 20 30% 49 1994 391% -741% 1792 3343 50 1995 5.58% 31.67% 3771% 33.215 51 1995 5.50% -0.81% 22.07% 52 1997 16.50% 5,32% 15.08% 33.17% 22.38% 53 1998 5.11% 13.52% 28.58% 54 1999 -255 4.BOX -876% 21.04% 2128 55 50-year average 5.226% 5.936% 14.890% 17.103% Standard 56 Deviation 2.980% 9.493% 16.695% 29.06% 57 Note: Sources for annual returns are the Center for Rescarch on Security Prices, Sandard & Poor's 58 500 index, Russell 2000 index, and Solomon-Smith Barney US Treasury bill Index 59 80
Step by Step Solution
There are 3 Steps involved in it

Get step-by-step solutions from verified subject matter experts