

Question: Hey Can Someone Help 2 3 16 18 9 10 55:41 The graph shows the distribution of the amount of Which statement describes the distribution?
Hey Can Someone Help
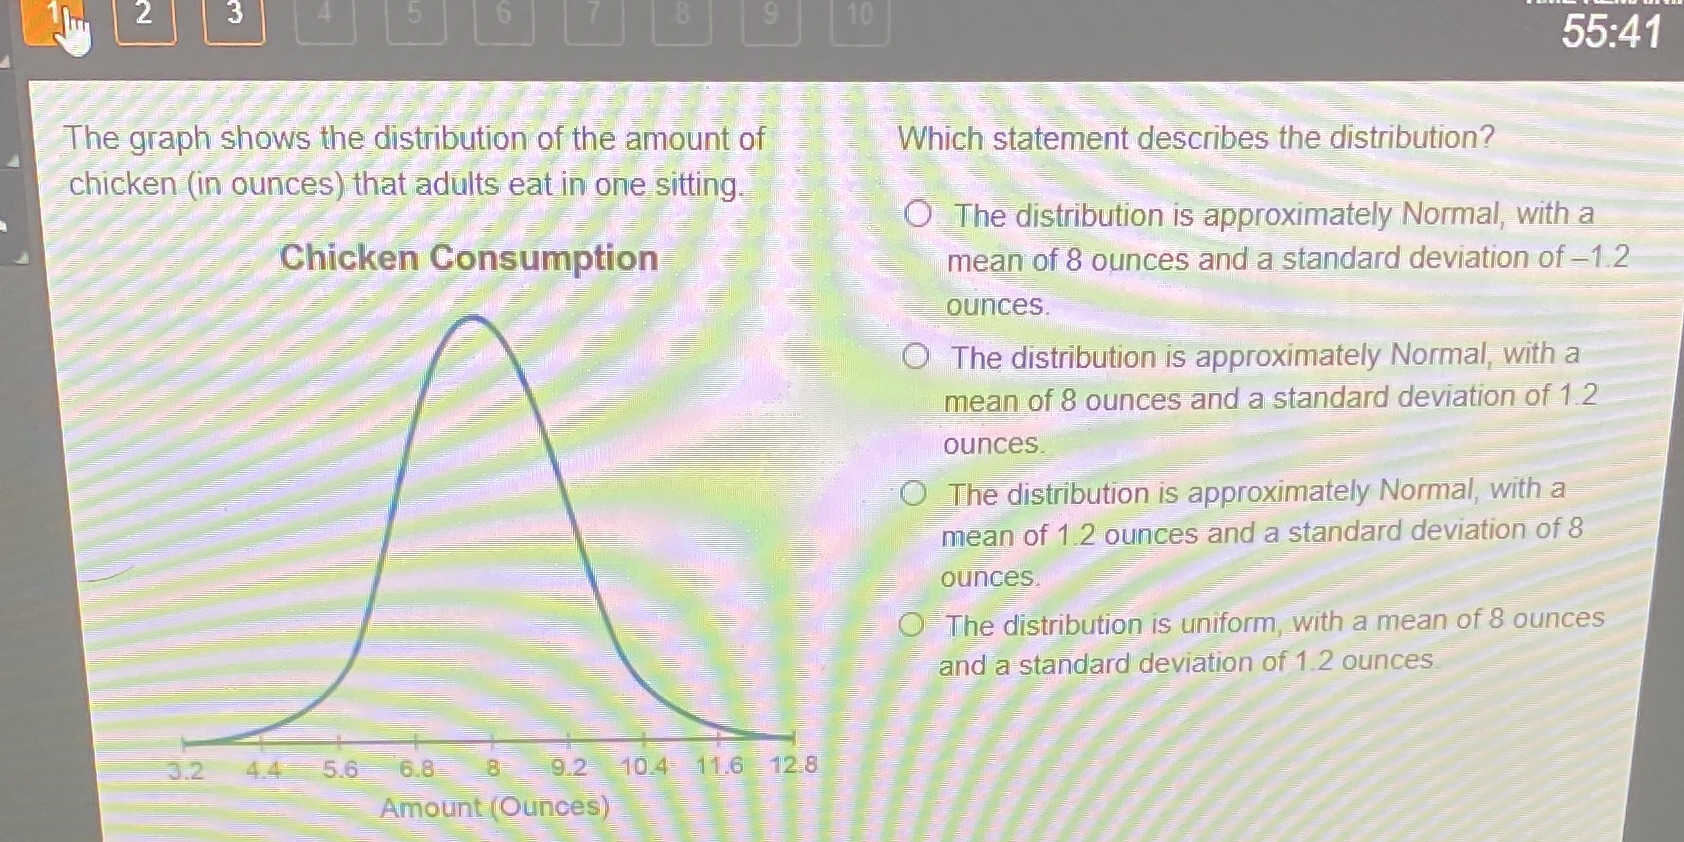
2 3 16 18 9 10 55:41 The graph shows the distribution of the amount of Which statement describes the distribution? chicken (in ounces) that adults eat in one sitting. O The distribution is approximately Normal, with a Chicken Consumption mean of 8 ounces and a standard deviation of -1.2 ounces. The distribution is approximately Normal, with a mean of 8 ounces and a standard deviation of 1.2 ounces. O The distribution is approximately Normal, with a mean of 1.2 ounces and a standard deviation of 8 ounces OF The distribution is uniform, with a mean of 8 ounces and a standard deviation of 1.2 ounces 3.2 44 5.6 6.8 8 9.2 104 11.6 128 Amount (Ounces)
Step by Step Solution
There are 3 Steps involved in it

Get step-by-step solutions from verified subject matter experts