

Question: Hey, I need help with problems from 11 to 16 and with problems 24, 29 and 32. Please!! Graphical Analysis In Exercises 11-16, determine whether
Hey, I need help with problems from 11 to 16 and with problems 24, 29 and 32. Please!!
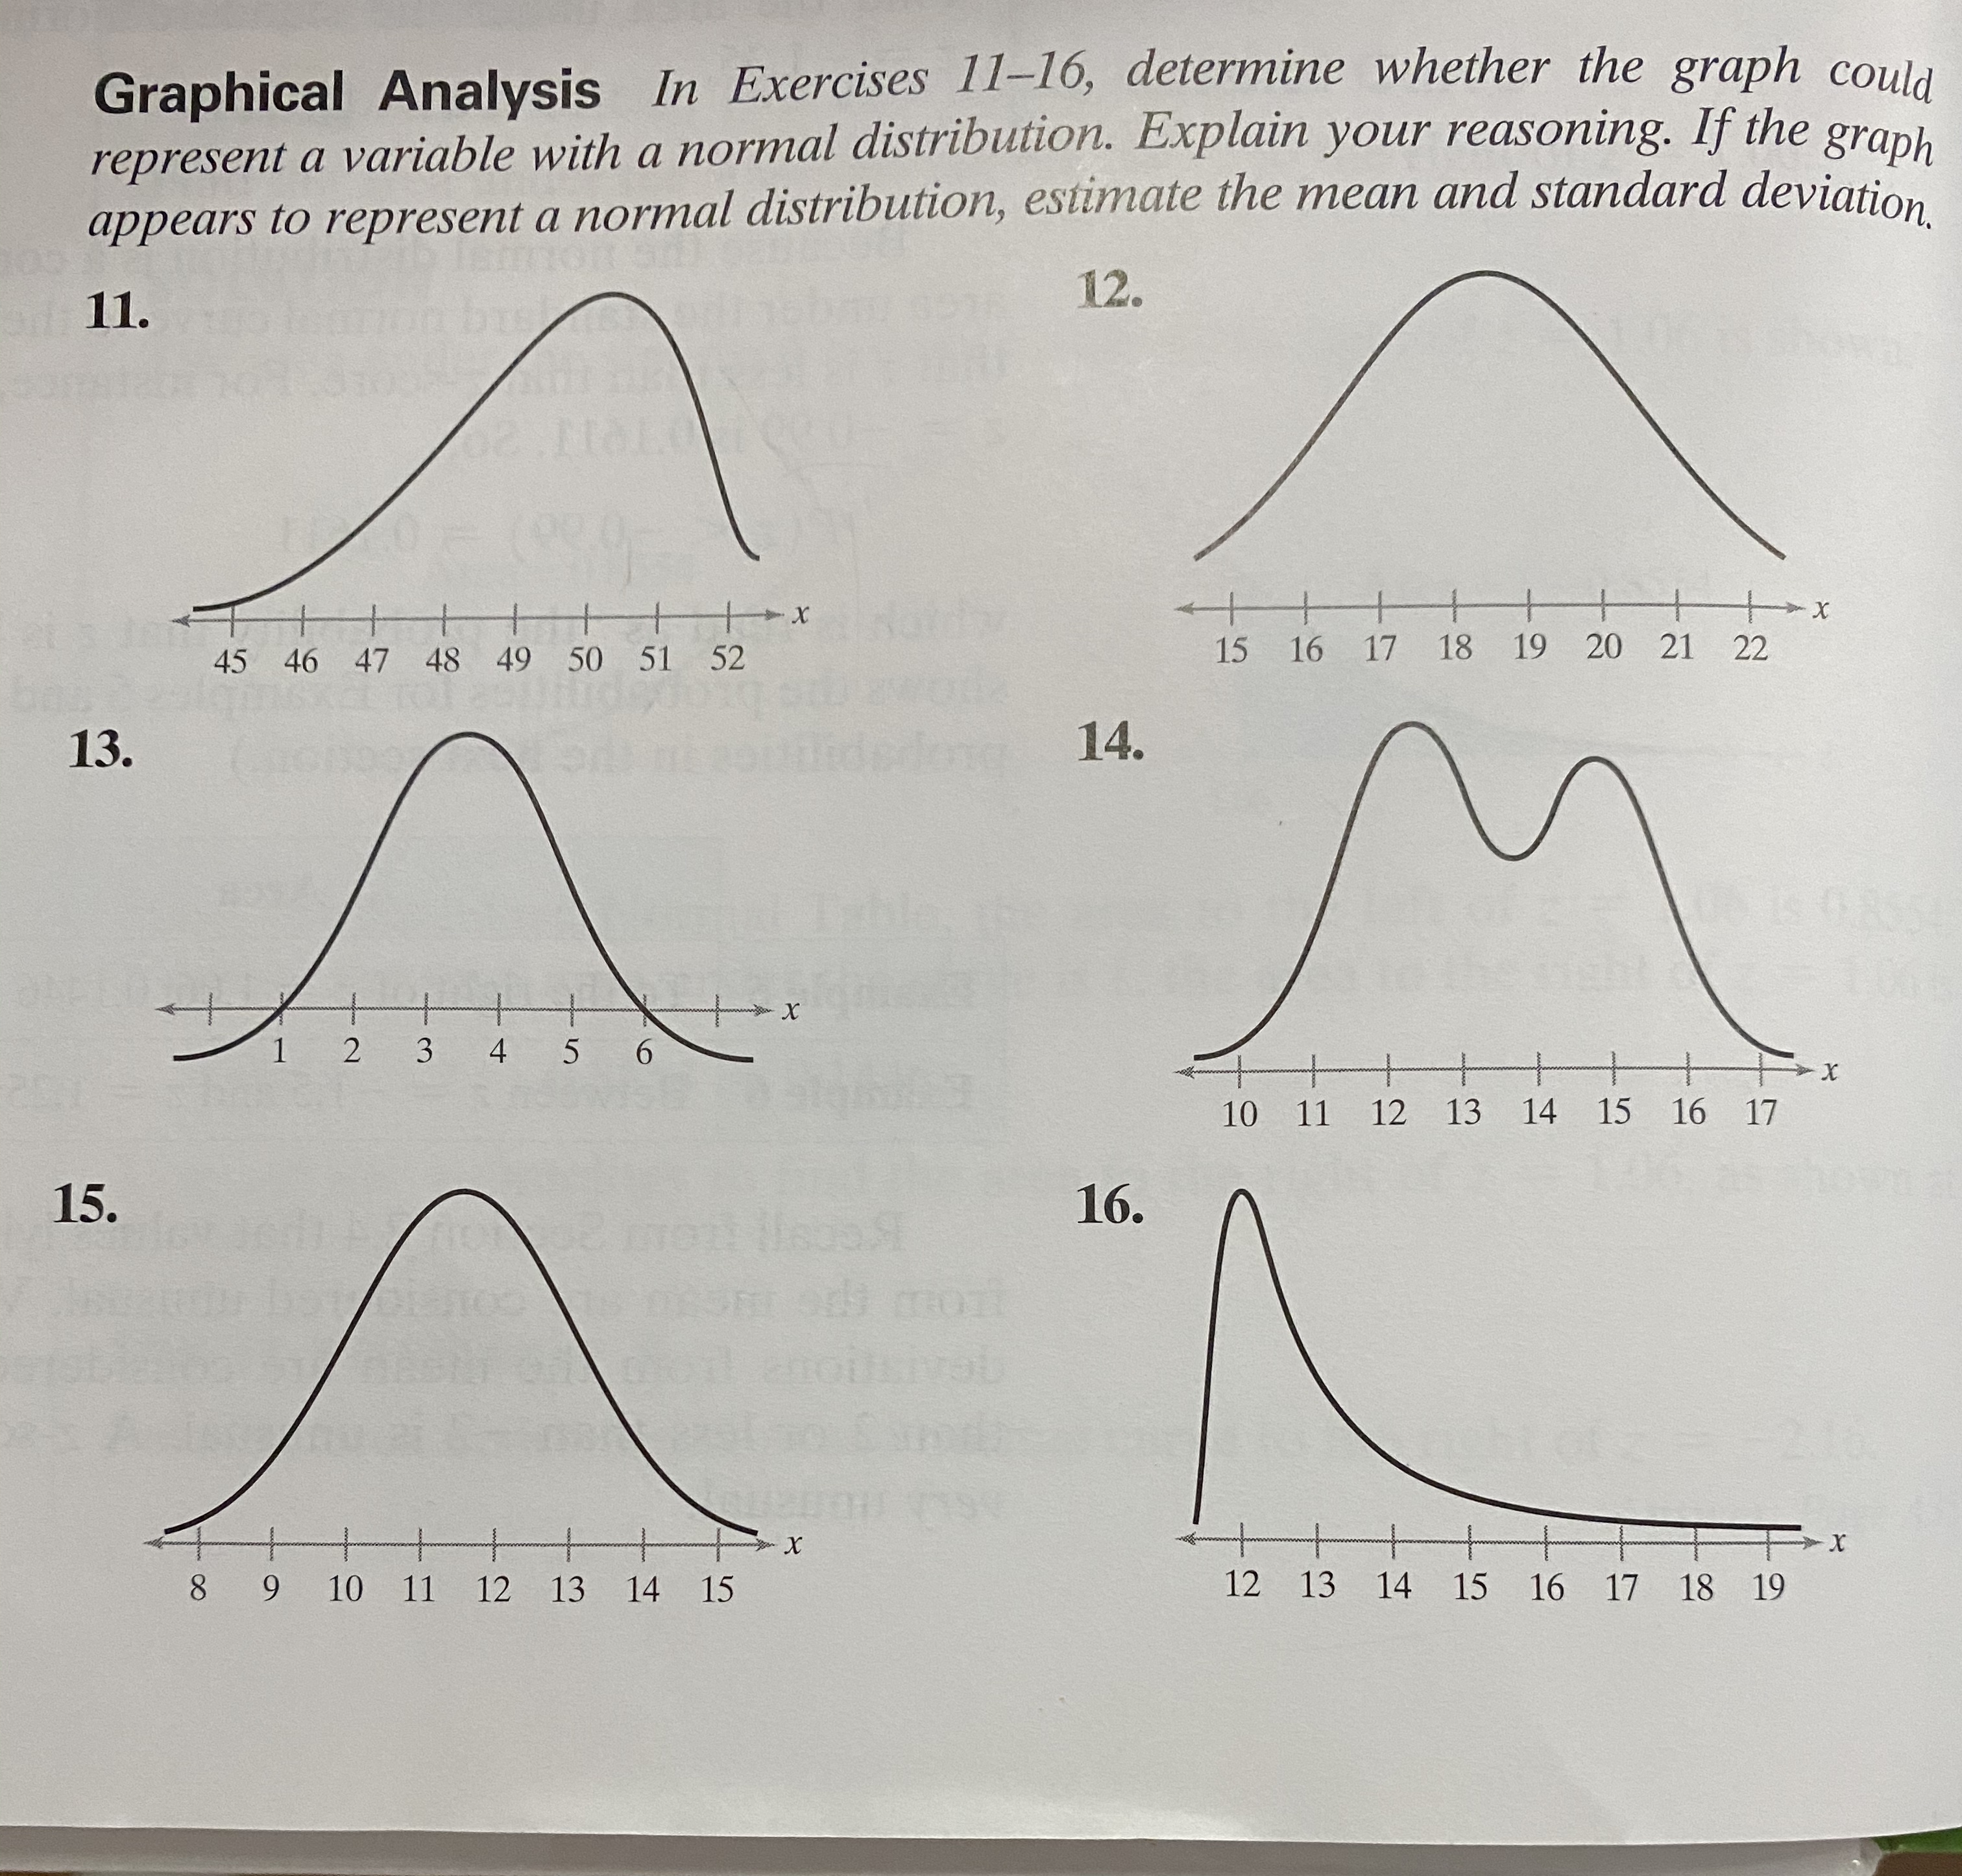
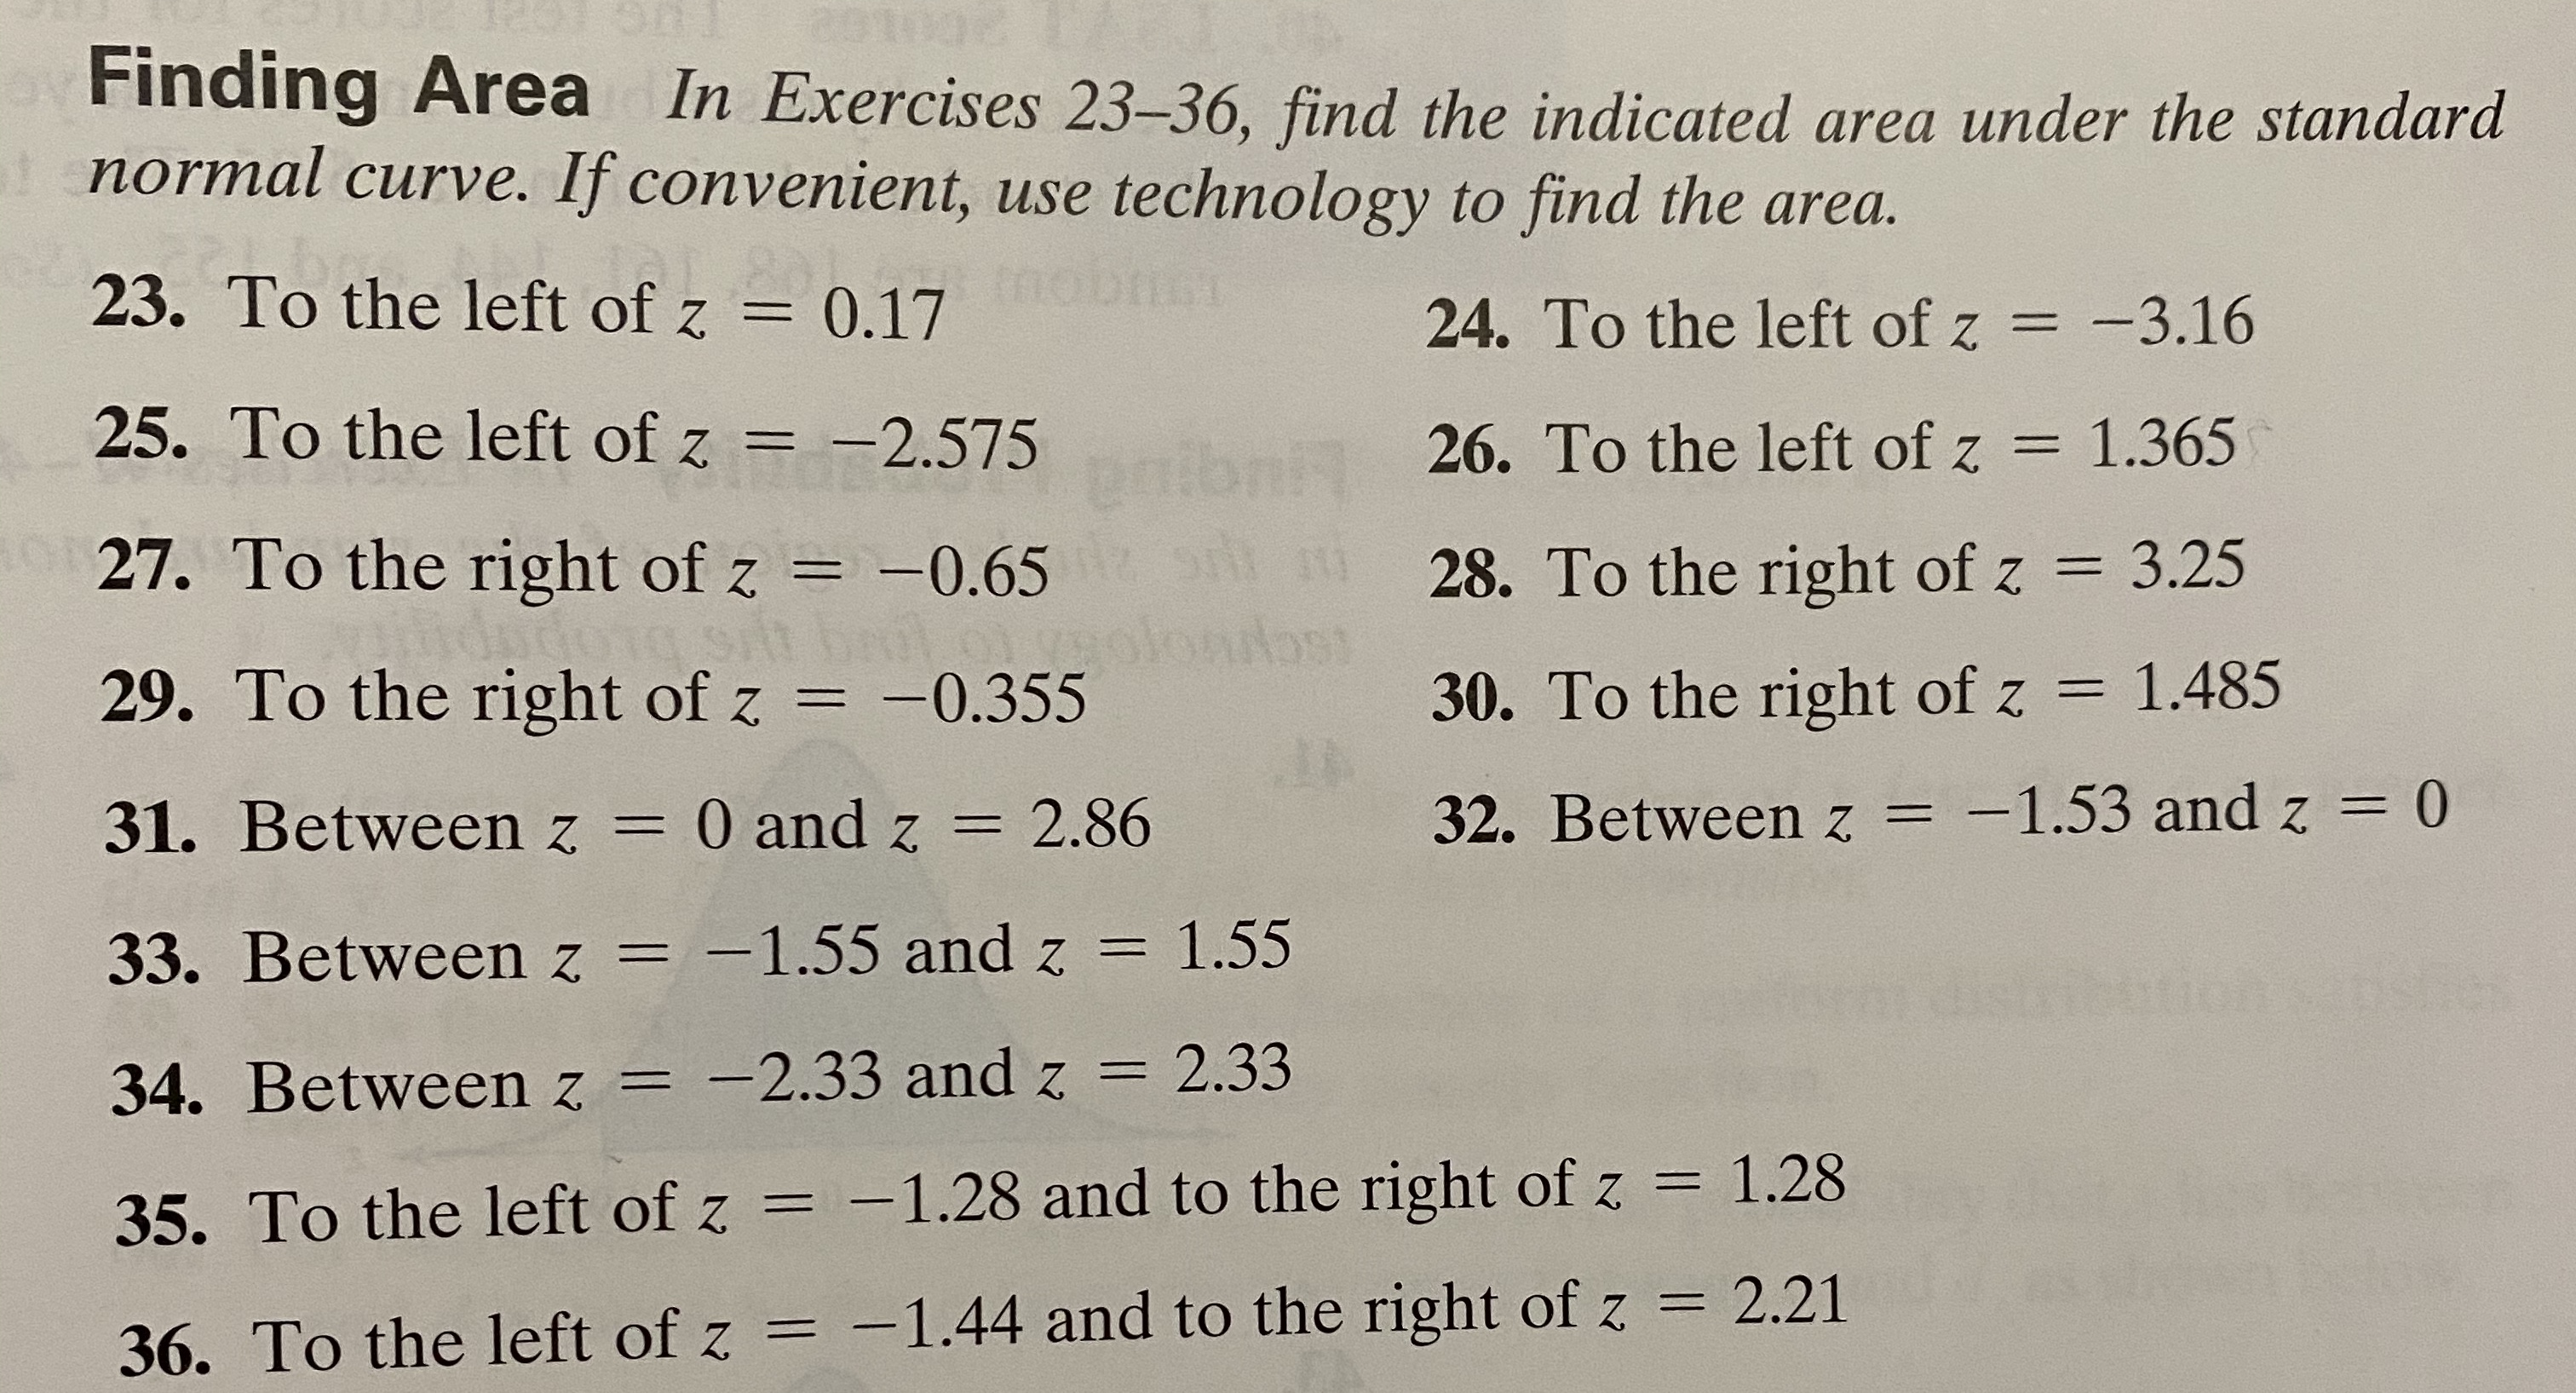
Graphical Analysis In Exercises 11-16, determine whether the graph could represent a variable with a normal distribution. Explain your reasoning. If the graph appears to represent a normal distribution, estimate the mean and standard deviation. 11. 12. 45 46 47 48 49 50 51 52 15 16 17 18 19 20 21 22 13. 14. am X 10 11 12 13 14 15 16 17 X 15. 16. 8 9 10 11 12 13 14 15 12 13 14 15 16 17 18 19 XFinding Area In Exercises 23-36, find the indicated area under the standard normal curve. If convenient, use technology to find the area. 23. To the left of z = 0.17 24. To the left of z = -3.16 25. To the left of z = -2.575 26. To the left of z = 1.365 27. To the right of z = -0.65 28. To the right of z = 3.25 29. To the right of z = -0.355 30. To the right of z = 1.485 31. Between z = 0 and z = 2.86 32. Between z = -1.53 and z = 0 33. Between z = -1.55 and z = 1.55 34. Between z = -2.33 and z = 2.33 35. To the left of z = -1.28 and to the right of z = 1.28 36. To the left of z = -1.44 and to the right of z = 2.21
Step by Step Solution
There are 3 Steps involved in it

Get step-by-step solutions from verified subject matter experts