

Question: hey so im trying to figure out this problem, the yellow sections I filled in, but I wanted to know, what is the error in
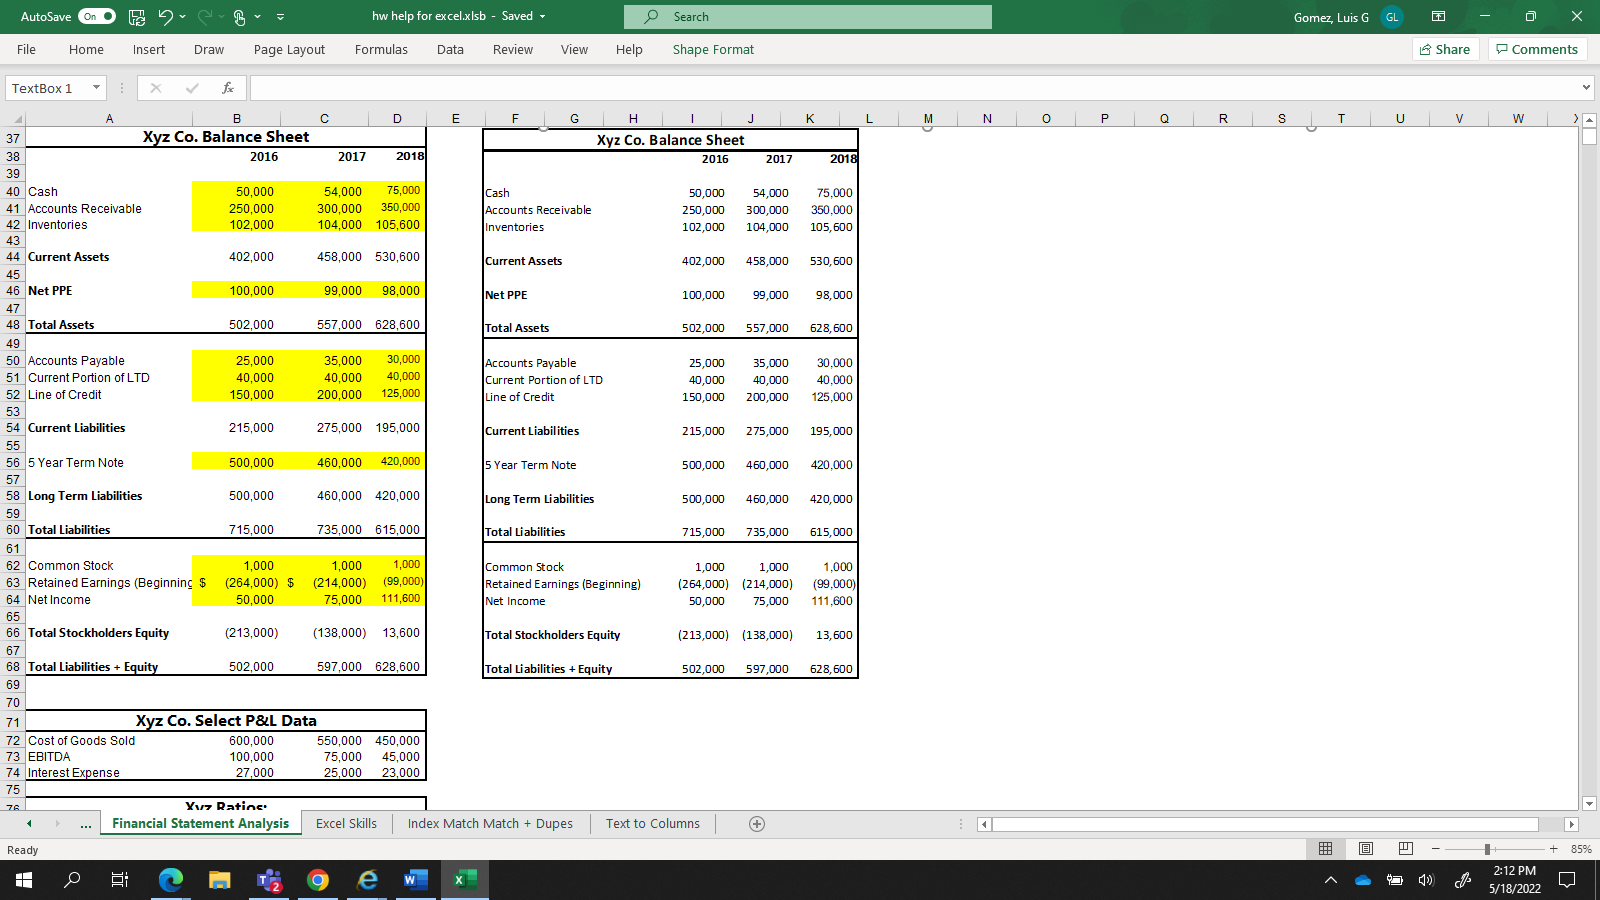 hey so im trying to figure out this problem, the yellow sections I filled in, but I wanted to know, what is the error in the balance sheet that are given, which is the balance sheet on the right, and the p and L on the bottom left side, that is the only given information and I wanted to know how to spot the error in the balance sheet, for the example the balance don't add up in 2017 and 2018 and I thought it had something to do with the cash and retained earnings and net income, again the yellow sections I filled myself and was supposed to fill in the correct information. please let me know what you think. There is no more given information on the problem
AutoSave On hw help for excel.x Isb - Saved - Search Gomez, Luis G GL 7 o X File Home Insert Draw Page Layout Formulas Data Review View Help Shape Format Share Comments TextBox 1 x foc M N o 0 R S T U V w > Cash A B E F G H I J K 37 Xyz Co. Balance Sheet Xyz Co. Balance Sheet 38 2016 2017 2018 2016 2017 2018 39 40 Cash 50,000 54,000 75,000 50,000 54,000 75,000 41 Accounts Receivable 250,000 300,000 350,000 Accounts Receivable 250,000 300,000 350.000 42 Inventories 102,000 104,000 105,600 Inventories 102,000 104,000 105,600 43 44 Current Assets 402,000 458,000 530,600 Current Assets 402,000 458,000 530,600 45 46 Net PPE 100,000 99,000 98,000 Net PPE 100,000 99,000 98,000 47 48 Total Assets 502,000 557,000 628,600 Total Assets 502,000 557,000 628,600 49 50 Accounts Payable 25,000 35,000 30,000 Accounts Payable 25,000 35,000 30.000 51 Current Portion of LTD 40,000 40,000 40,000 Current Portion of LTD 40,000 40,000 40.000 52 Line of Credit 150,000 200,000 125,000 Line of Credit 150,000 200,000 125,000 53 54 Current Liabilities 215,000 275,000 195,000 Current Liabilities 215,000 275,000 195,000 55 56 5 Year Term Note 500,000 460,000 420,000 5 Year Term Note 500,000 460,000 420.000 57 58 Long Term Liabilities 500,000 460,000 420,000 Long Term Liabilities 500,000 460,000 420,000 59 60 Total Liabilities 715,000 735,000 615,000 Total Liabilities 715,000 735,000 615,000 61 62 Common Stock 1,000 1,000 1,000 Common Stock 1,000 1,000 1,000 63 Retained Earnings (Beginning $ (264,000) $ (214,000) (99,000) Retained Earnings (Beginning) (264,000) (214,000) (99,000) 64 Net Income 50,000 75,000 111,600 Net Income 50,000 75,000 111.600 65 66 Total Stockholders Equity (213,000) (138,000) 13,600 Total Stockholders Equity (213,000) (138,000) 13,600 67 68 Total Liabilities + Equity 502,000 597,000 628,600 Total Liabilities + Equity 502,000 597,000 628,600 69 70 71 Xyz Co. Select P&L Data 72 Cost of Goods Sold 600,000 550,000 450,000 73 EBITDA 100,000 75,000 45,000 74 Interest Expense 27,000 25,000 23,000 75 Xvz Ratins Financial Statement Analysis Excel Skills Index Match Match + Dupes Text to Columns + Bugggg 76 Ready B + 85% HH e W ) 2:12 PM 5/18/2022 L
Step by Step Solution
There are 3 Steps involved in it

Get step-by-step solutions from verified subject matter experts