

Question: Hey tutor I need your help can you analysis the graph which I attached below and answer for that 6 question Thank you in advance
Hey tutor I need your help
can you analysis the graph which I attached below and answer for that 6 question
Thank you in advance
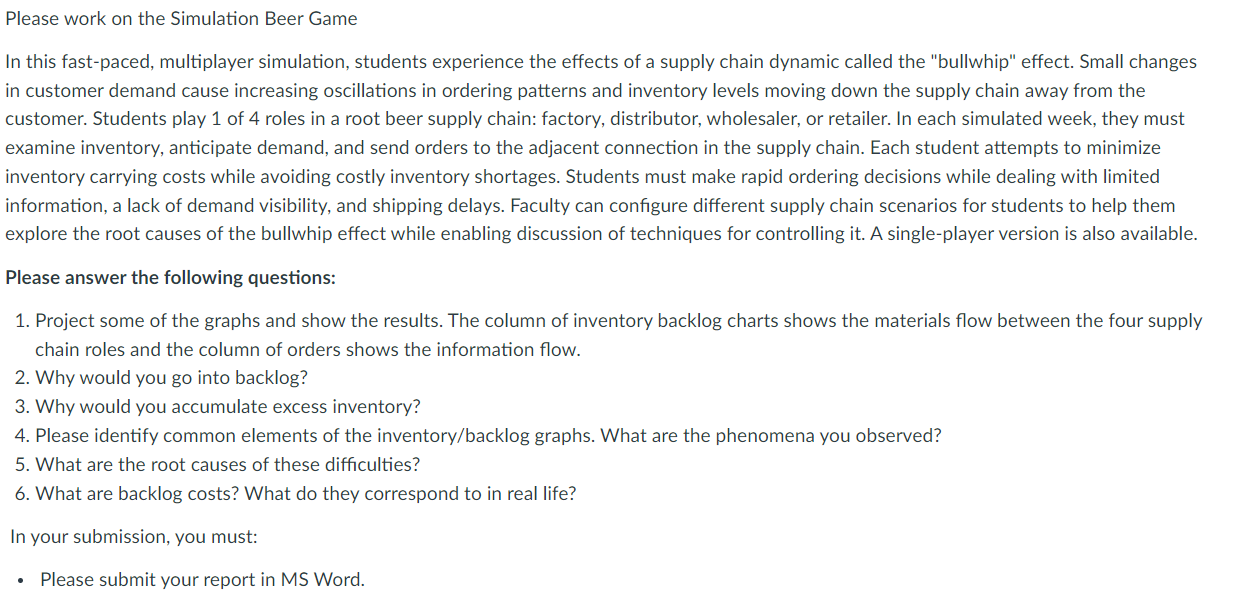
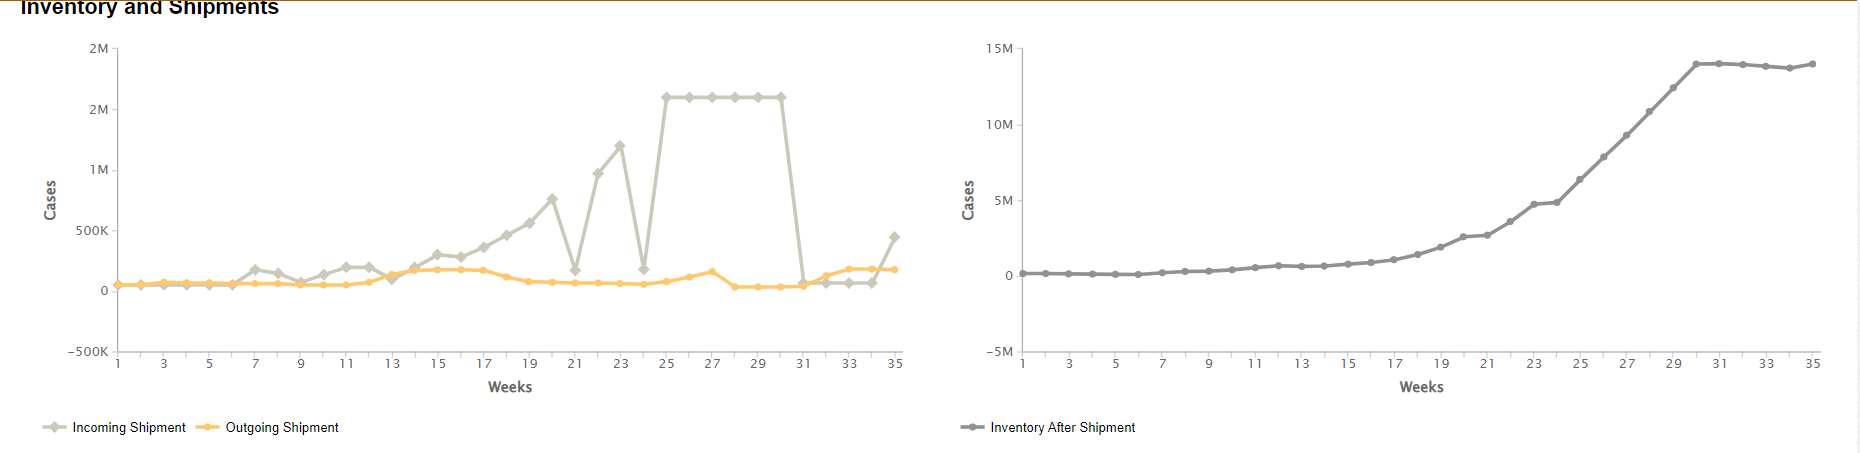
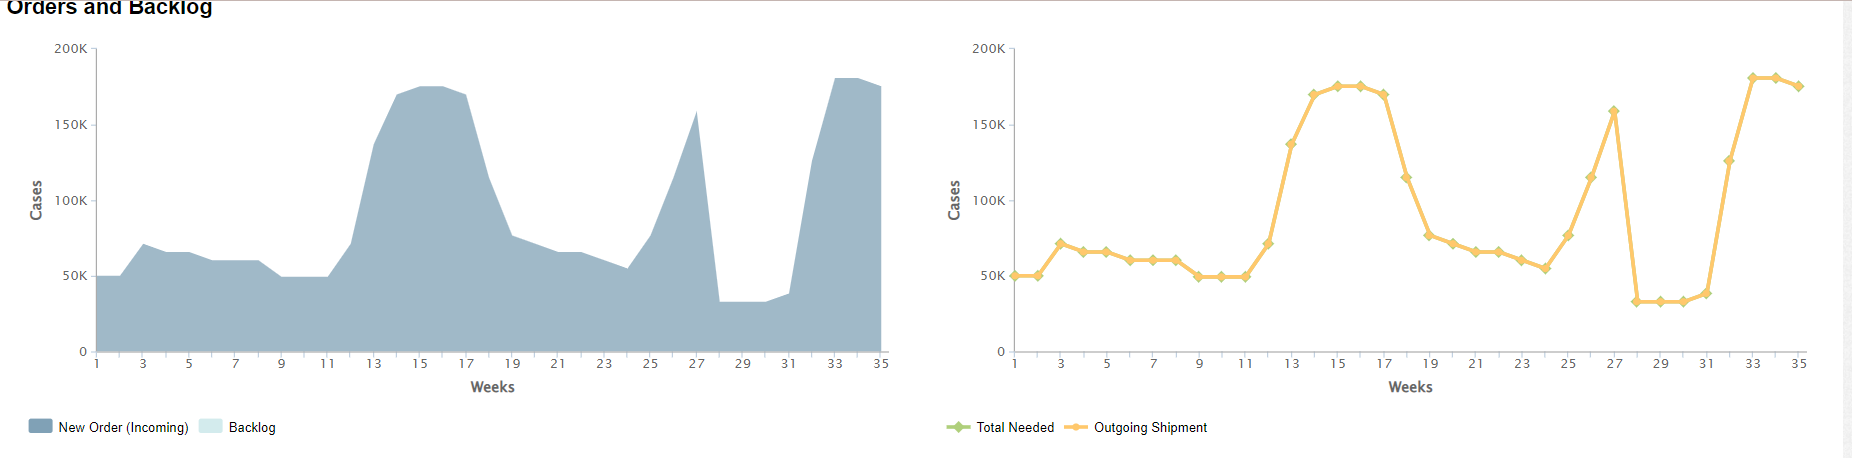
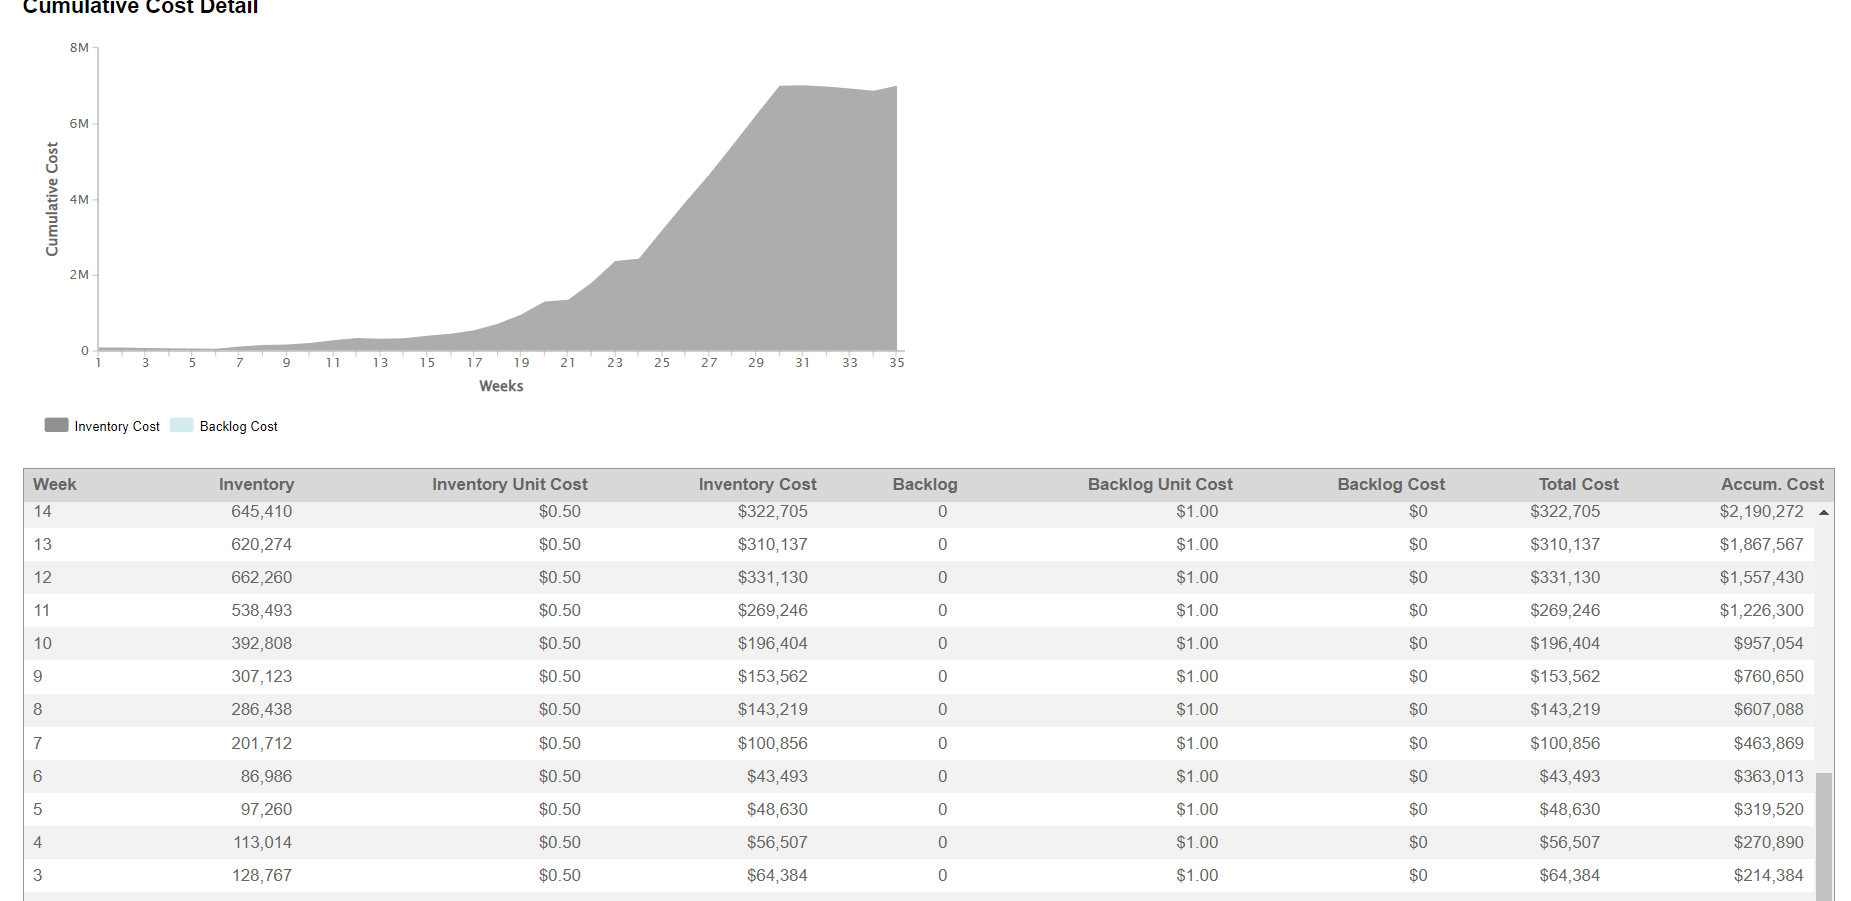
Please work on the Simulation Beer Game In this fastpaced, multiplayer simulation, students experience the effects of a supply chain dynamic called the "bullwhip" effect. Small changes in customer demand cause increasing oscillations in ordering patterns and inventory levels moving down the supply chain away from the customer. Students play 1 of 4 roles in a root beer supply chain: factory, distributor, wholesaler, or retailer. In each simulated week, they must examine inventory, anticipate demand, and send orders to the adjacent connechon in the supply chain. Each student attempts to minimize inventory carrying costs while avoiding costly inventory shortages. Students must make rapid ordering decisions while dealing with limited information, a lack of demand visibility, and shipping delays. Faculty can configure different supply chain scenarios for students to help them explore the root causes of the bullwhip effect while enabling discussion of techniques for controlling it. A singleplayer version is also available. Please answer the following questions: 1. Project some of the graphs and show the results. The column of inventory backlog charts shows the materials flow between the four supply chain roles and the column of orders shows the information flow. 2. Why would you go into backlog? 3. Why would you accumulate excess inventory? 4. Please identify common elements of the inventory/backlog graphs. What are the phenomena you observed? 5. What are the root causes of these difculties? 6. What are backlog costs? What do they correspond to in real life? In your submission, you must: . Please submit your report in MS Word. Inventory and Shipments 2M 15M 2M 10M 1M Cases Cases 5M 500K 0 0 -500K -5M 3 5 7 9 11 13 15 17 19 21 23 25 27 29 31 33 35 3 5 7 9 11 13 15 17 19 21 23 25 27 29 31 33 35 Weeks Weeks Incoming Shipment Outgoing Shipment Inventory After ShipmentOrders and Backlog 200K - 200K 150K 150K Cases 100K Cases 10OK 50K 50K 35 29 31 33 35 3 5 7 9 11 13 15 17 19 21 23 25 27 29 31 33 3 5 7 9 11 13 15 17 19 21 23 25 27 Weeks Weeks Total Needed Outgoing Shipment New Order (Incoming) BacklogCumulative Cost Detail 8M 6M Cumulative Cost 4M 2M 5 7 9 11 13 15 17 19 21 23 25 27 29 31 33 35 Weeks Inventory Cost Backlog Cost Week Inventory Inventory Unit Cost Inventory Cost Backlog Backlog Unit Cost Backlog Cost Total Cost Accum. Cost 14 645,410 $0.50 $322,705 0 $1.00 $0 $322,705 $2, 190,272 - 13 620,274 $0.50 $310,137 O $1.00 $0 $310, 137 $1,867,567 12 662,260 $0.50 $331, 130 O $1.00 $0 $331,130 $1,557,430 11 538,493 $0.50 $269,246 $1.00 $0 $269,246 $1,226,300 10 392,808 $0.50 $196,404 $1.00 $0 $196,404 $957,054 307, 123 $0.50 $153,562 $1.00 $0 oooooo $153,562 $760,650 286,438 $0.50 $143,219 $1.00 $0 $143,219 $607,088 201,712 $0.50 $100,856 $1.00 $0 $100,856 $463,869 86,986 $0.50 $43,493 $1.00 $0 $43,493 $363,013 97,260 $0.50 $48,630 $1.00 $0 $48,630 $319,520 113,014 $0.50 $56,507 $1.00 $0 $56,507 $270,890 128,767 $0.50 $64,384 $1.00 $0 $64,384 $214,384
Step by Step Solution
There are 3 Steps involved in it

Get step-by-step solutions from verified subject matter experts