

Question: hh Now, we consider a probability density function that represents a probability distribution over the range of 0 to 1. Figure 5,5 is a graph
hh
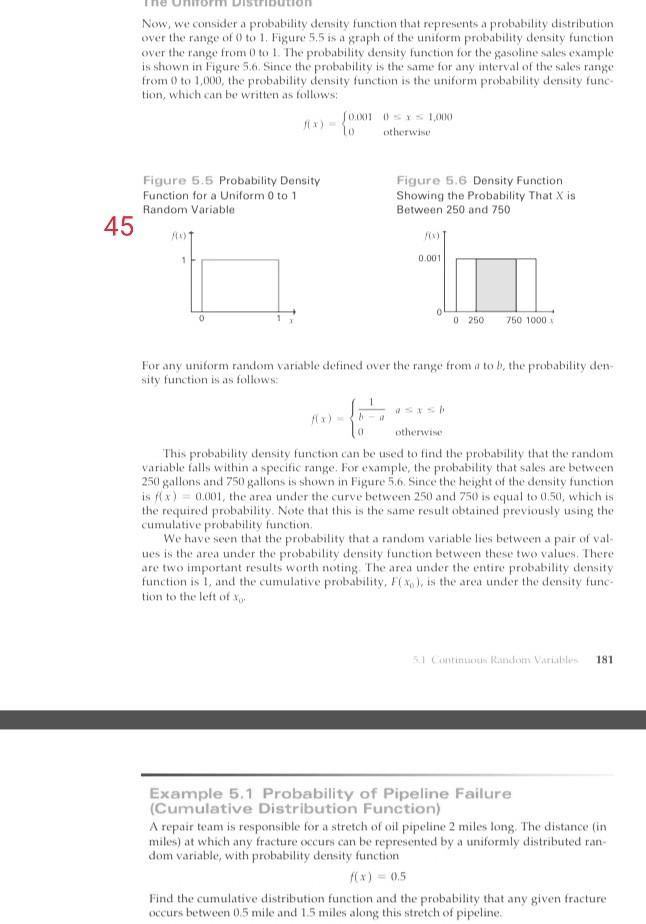
Now, we consider a probability density function that represents a probability distribution over the range of 0 to 1. Figure 5,5 is a graph of the uniform probability density function over the range from 0 to 1. The probability density function for the gasoline sales example is shown in Figure 5.6. Since the probability is the same for any interval of the sales range from 0 to 1,000, the probability density function is the uniform probability density func tion, which can be written as follows: SOMOSYS 1,000 otherwise Figure 5.5 Probability Density Function for a Uniform 0 to 1 Random Variable Figure 5.6 Density Function Showing the Probability That X is Between 250 and 750 45 10) 1 0.001 0 0 250 750 1000 For any unitorm random variable defined over the range from a tob, the probability den sity function is as follows: (1 otherwise This probability density function can be used to find the probability that the random variable falls within a specific range. For example, the probability that sales are between 250 gallons and 750 gallons is shown in Figure 5.6. Since the height of the density function is x) = 0,001, the area under the curve between 250 and 750) is equal to 0.50, which is the required probability. Note that this is the same result obtained previously using the cumulative probability function, We have seen that the probability that a random variable lies between a pair of val. ucs is the area under the probability density function between these two values. There are two important results worth noting The area under the entire probability density function is 1, and the cumulative probability, Fixo), is the area under the density func- tion to the left of 51 Continuous Randon Variable 181 Example 5.1 Probability of Pipeline Failure (Cumulative Distribution Function) A repair team is responsible for a stretch of oil pipeline 2 miles long. The distance (in miles) at which any fracture occurs can be represented by a uniformly distributed ran dom variable, with probability density function f(x) = 0.5 Find the cumulative distribution function and the probability that any given fracture occurs between 0.5 mile and 15 miles along this stretch of pipelineStep by Step Solution
There are 3 Steps involved in it
1 Expert Approved Answer
Step: 1 Unlock

Question Has Been Solved by an Expert!
Get step-by-step solutions from verified subject matter experts
Step: 2 Unlock
Step: 3 Unlock