

HHS 4C/U Family Types Survey Assignment K/U-23 T- 18 C- /6 APP-8 TOTAL- /45 marks Social...
Fantastic news! We've Found the answer you've been seeking!
Question:


Transcribed Image Text:
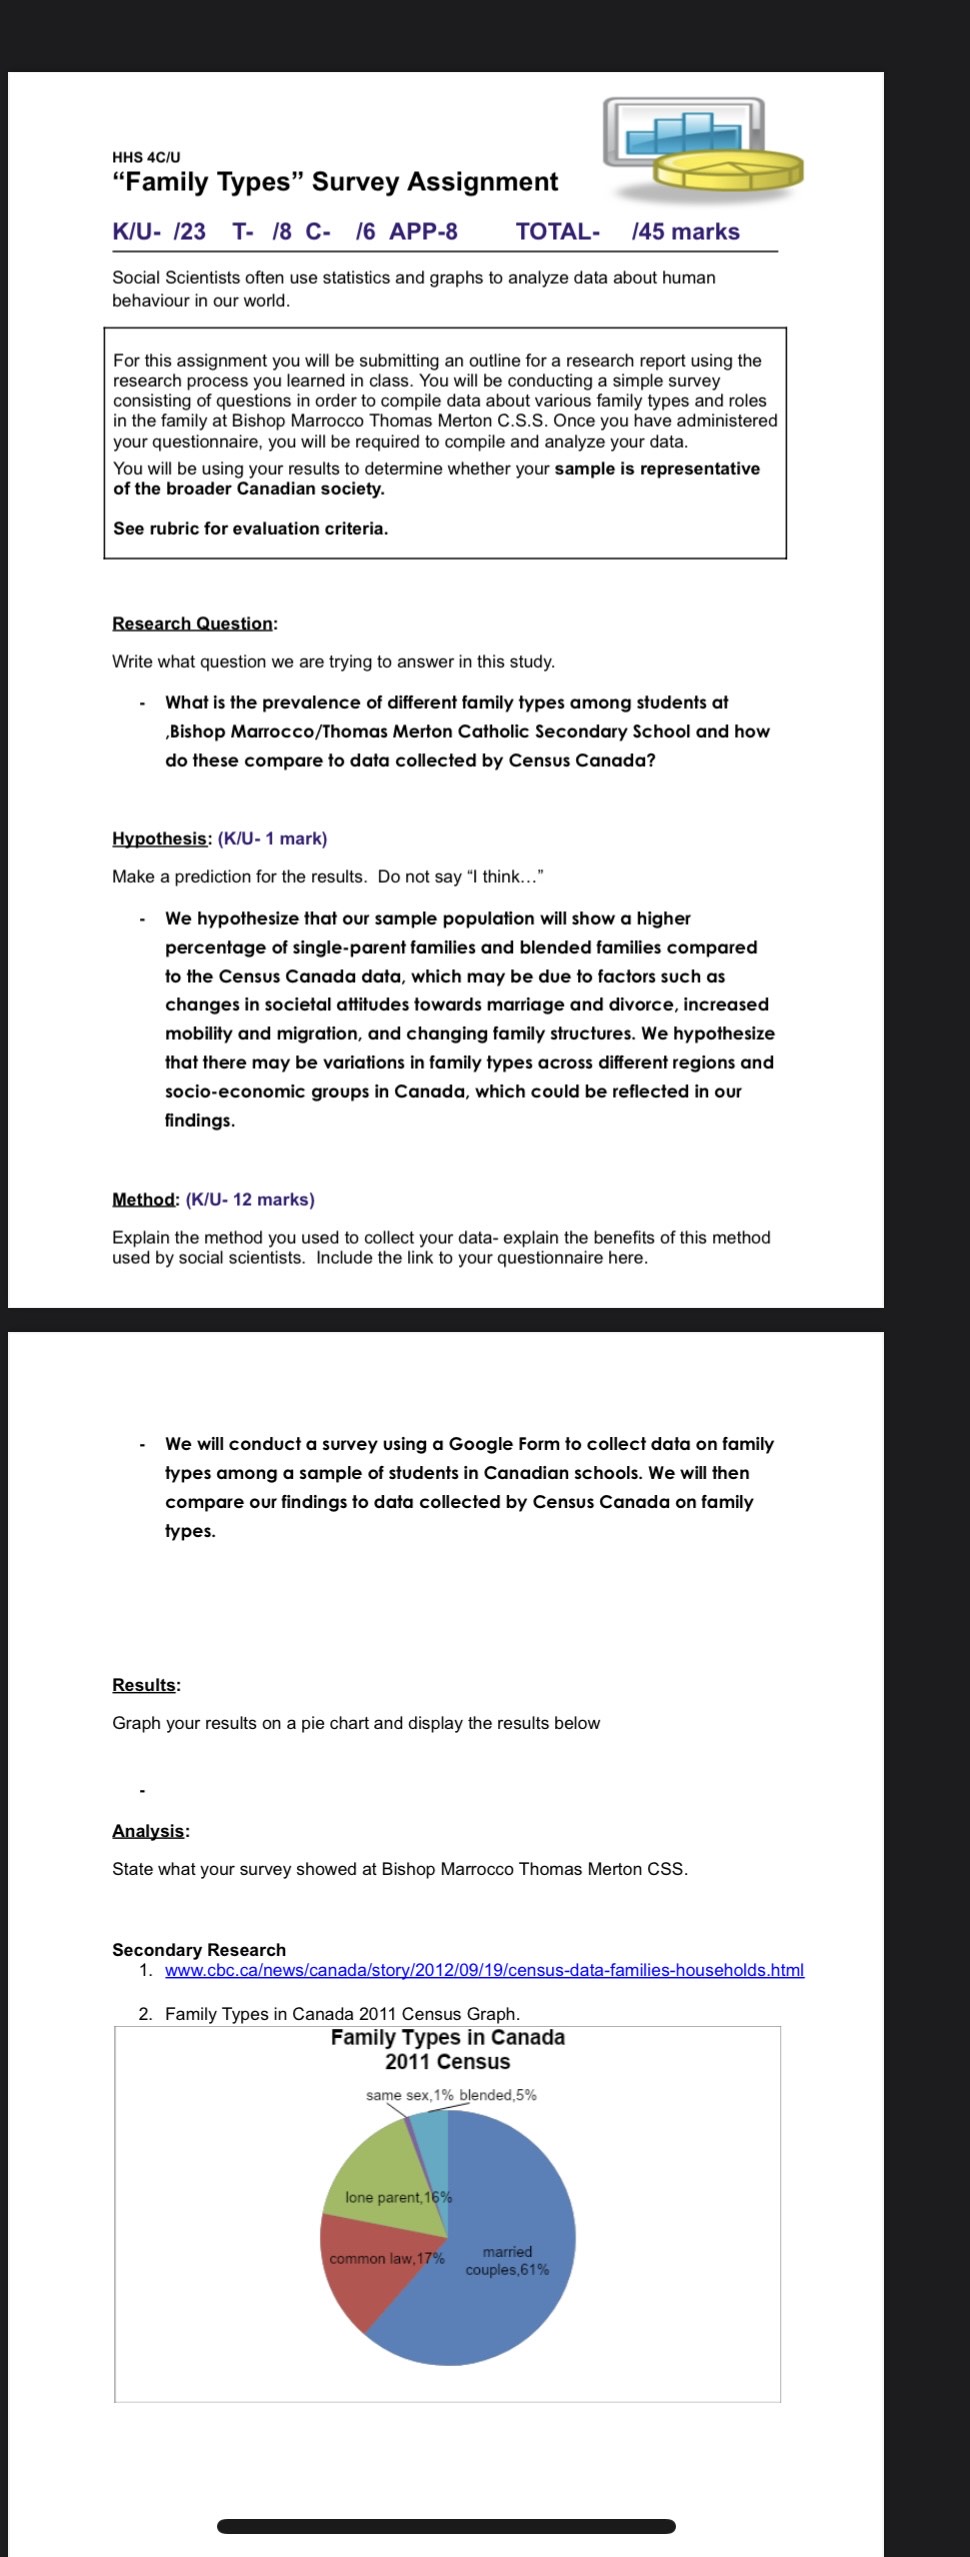
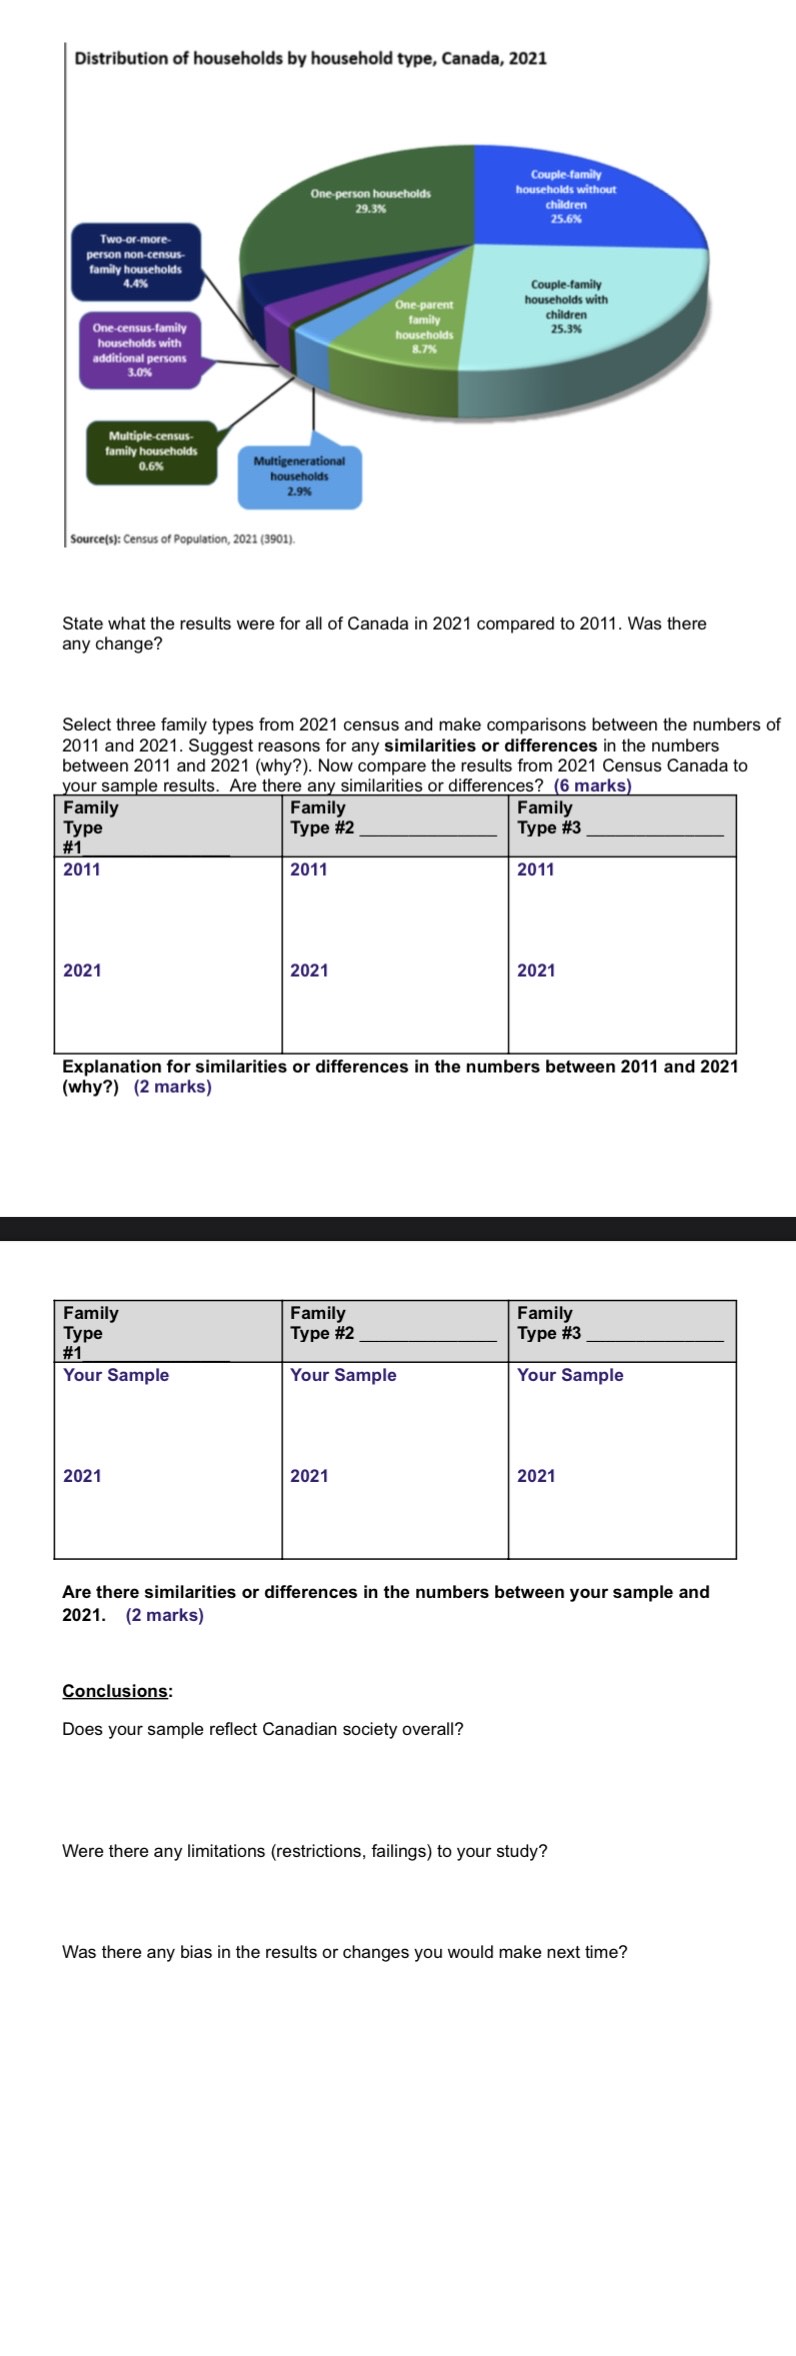
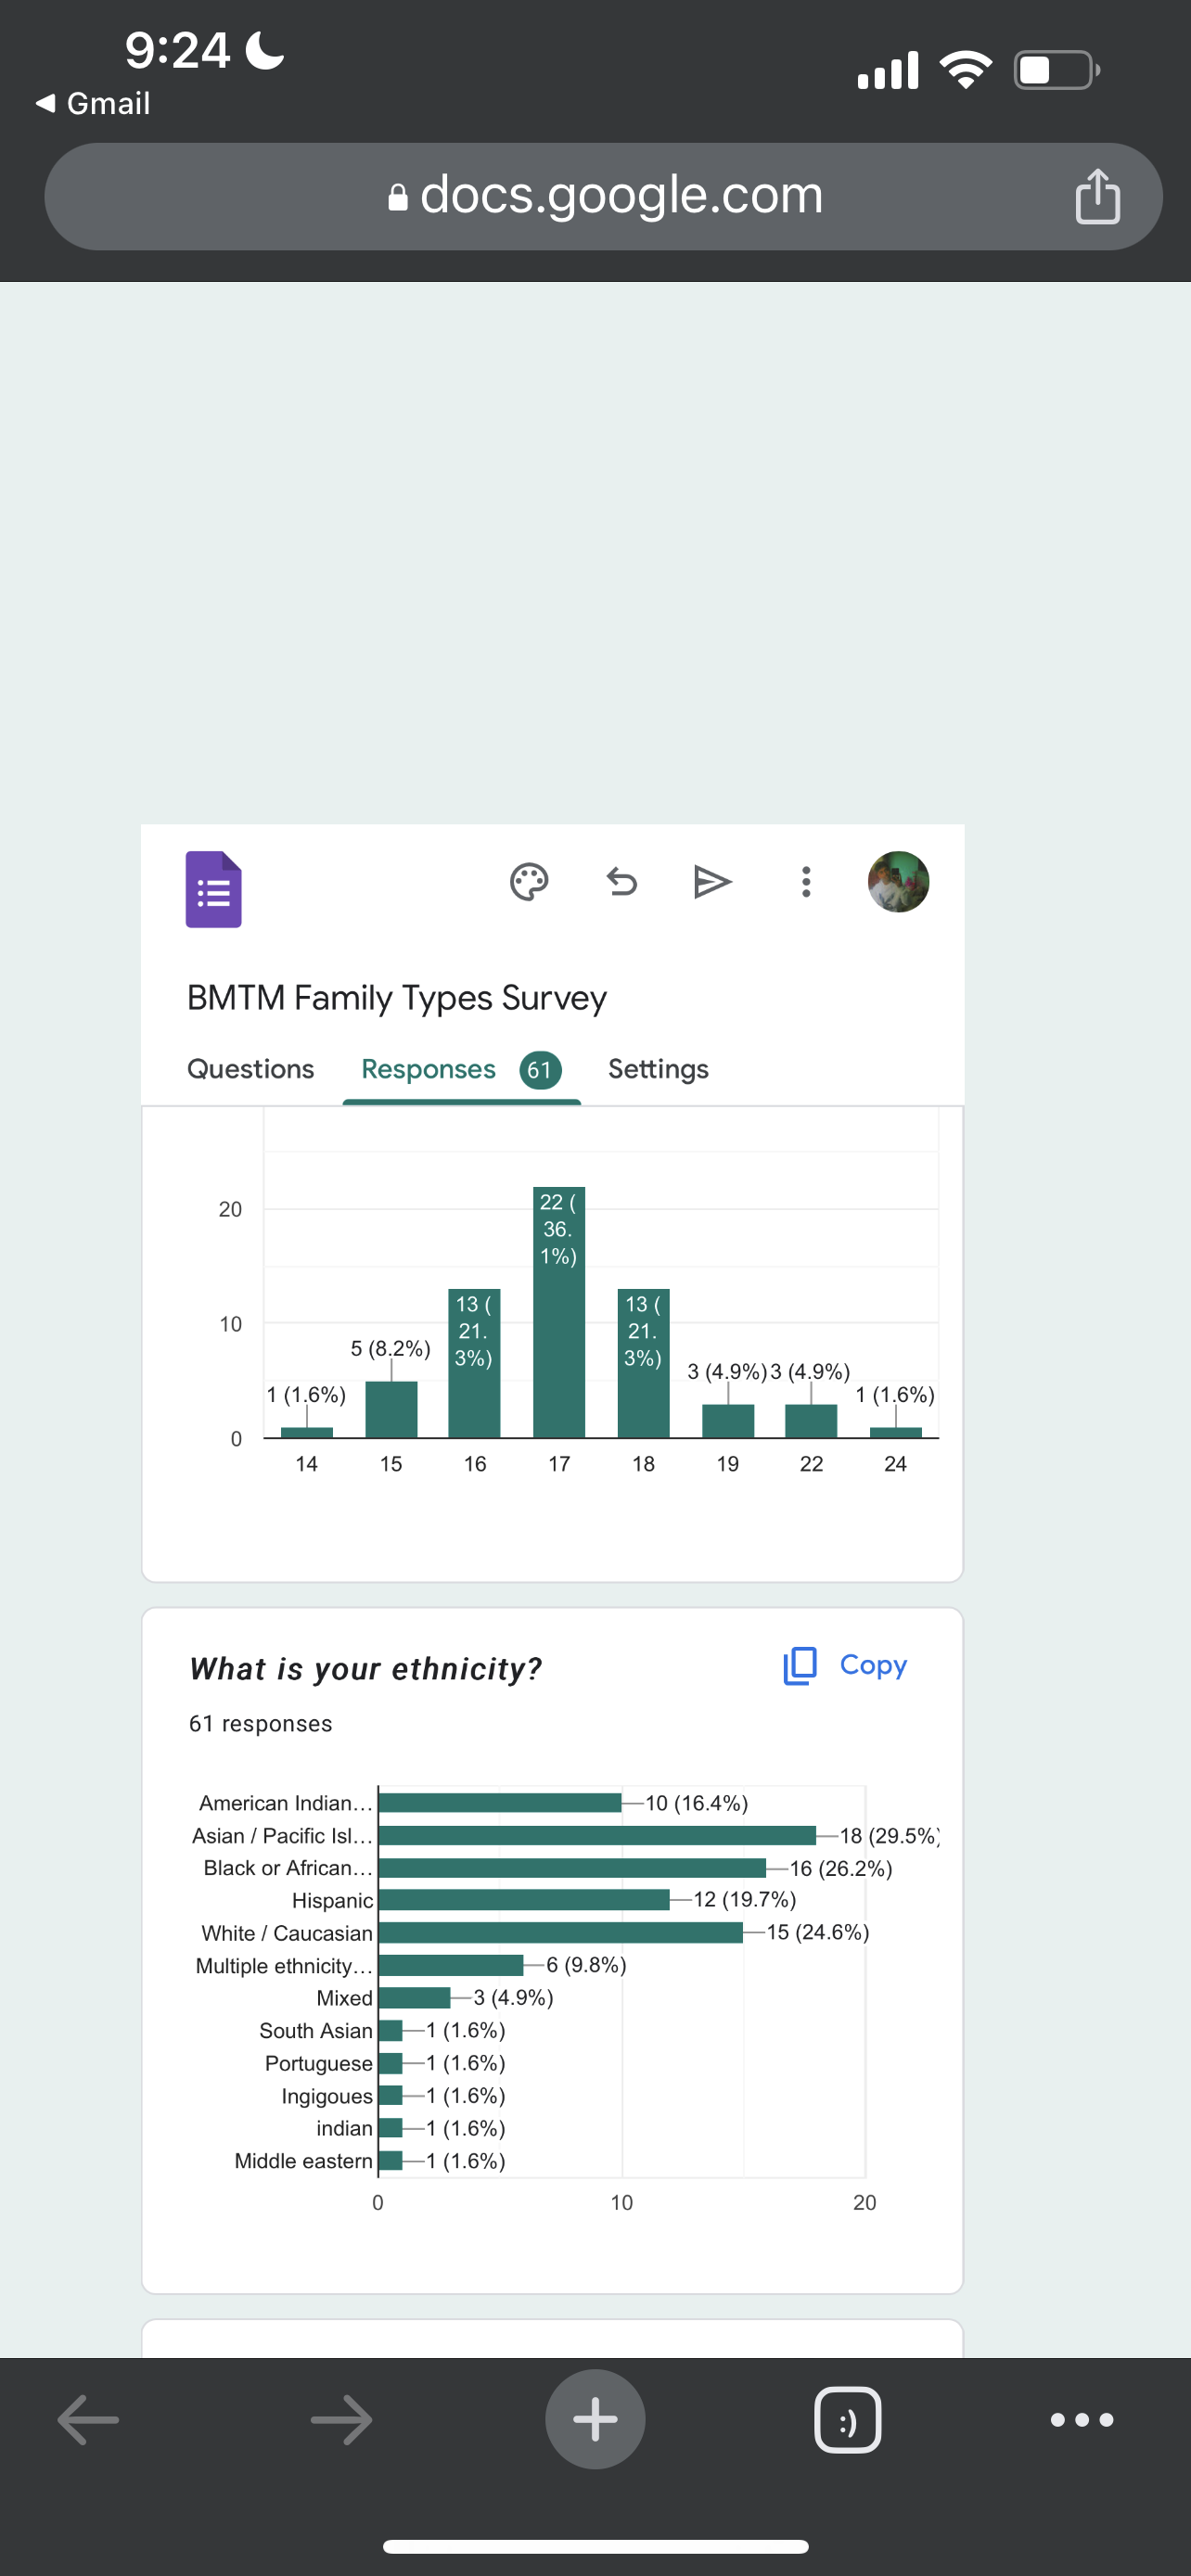
HHS 4C/U "Family Types" Survey Assignment K/U-23 T- 18 C- /6 APP-8 TOTAL- /45 marks Social Scientists often use statistics and graphs to analyze data about human behaviour in our world. For this assignment you will be submitting an outline for a research report using the research process you learned in class. You will be conducting a simple survey consisting of questions in order to compile data about various family types and roles in the family at Bishop Marrocco Thomas Merton C.S.S. Once you have administered your questionnaire, you will be required to compile and analyze your data. You will be using your results to determine whether your sample is representative of the broader Canadian society. See rubric for evaluation criteria. Research Question: Write what question we are trying to answer in this study. What is the prevalence of different family types among students at ,Bishop Marrocco/Thomas Merton Catholic Secondary School and how do these compare to data collected by Census Canada? Hypothesis: (K/U-1 mark) Make a prediction for the results. Do not say "I think..." We hypothesize that our sample population will show a higher percentage of single-parent families and blended families compared to the Census Canada data, which may be due to factors such as changes in societal attitudes towards marriage and divorce, increased mobility and migration, and changing family structures. We hypothesize that there may be variations in family types across different regions and socio-economic groups in Canada, which could be reflected in our findings. Method: (K/U-12 marks) Explain the method you used to collect your data- explain the benefits of this method used by social scientists. Include the link to your questionnaire here. We will conduct a survey using a Google Form to collect data on family types among a sample of students in Canadian schools. We will then compare our findings to data collected by Census Canada on family types. Results: Graph your results on a pie chart and display the results below Analysis: State what your survey showed at Bishop Marrocco Thomas Merton CSS. Secondary Research 1. www.cbc.ca/news/canada/story/2012/09/19/census-data-families-households.html 2. Family Types in Canada 2011 Census Graph. Family Types in Canada 2011 Census same sex,1% blended,5% lone parent, 16% common law,17% married couples,61% Distribution of households by household type, Canada, 2021 Two-or-more- person non-census- family households 4.4% One-person households 29.3% Couple-family households without children 25.6% One-census-family households with additional persons 3.0% One-parent family households 8.7% Multiple-census- family households 0.6% Multigenerational households 2.9% Source(s): Census of Population, 2021 (3901). Couple-family households with children 25.3% State what the results were for all of Canada in 2021 compared to 2011. Was there any change? Select three family types from 2021 census and make comparisons between the numbers of 2011 and 2021. Suggest reasons for any similarities or differences in the numbers between 2011 and 2021 (why?). Now compare the results from 2021 Census Canada to your sample results. Are there any similarities or differences? (6 marks) Family Type #1 2011 2021 Family Type #2 2011 2021 Family Type #3 2011 2021 Explanation for similarities or differences in the numbers between 2011 and 2021 (why?) (2 marks) Family Type Family Type #2 Family Type #3 #1 Your Sample Your Sample Your Sample 2021 2021 2021 Are there similarities or differences in the numbers between your sample and 2021. (2 marks) Conclusions: Does your sample reflect Canadian society overall? Were there any limitations (restrictions, failings) to your study? Was there any bias in the results or changes you would make next time? 9:24- Gmail !!! docs.google.com BMTM Family Types Survey Questions Responses 61 Settings . 20 20 22 ( 36. 1%) 13 ( 21. ... 3 (4.9%) 3 (4.9%) 13 ( 110 21. 5 (8.2%) 3%) 3%) 1 (1.6%) 0 14 15 16 17 18 19 222 22 1 (1.6%) 24 What is your ethnicity? 61 responses Copy American Indian... Asian Pacific Isl... -10 (16.4%) -18 (29.5%) Black or African... -16 (26.2%) Hispanic White/Caucasian Multiple ethnicity... Mixed -12 (19.7%) -15 (24.6%) -6 (9.8%) -3 (4.9%) South Asian -1 (1.6%) Portuguese | (1.6%) Ingigoues Middle eastern -1 (1.6%) indian -1 (1.6%) -1 (1.6%) 0 10 20 20 + :) 9:25- Gmail docs.google.com BMTM Family Types Survey Questions Responses 61 Settings What family function do you value most in the family? 60 responses 20% 21.7% 20% . Copy 10% 21.7% Physical care of members Addition of new members Socialization of children Controlling the behavior of memb... Maintaining morale of members Production & cons... What is your family structure? 60 responses Copy 23.3% 26.7% 31.7% 16.7% Single-parent family Nuclear family Extended family Blended family I live with mom and dad > How many siblings do you have? + Copy :) 9:25- Gmail docs.google.com !!! BMTM Family Types Survey Questions Responses 61 Settings How many siblings do you have? 61 responses 11.5% 1 2 18% 11.5% 3 4 50 . none 13.1% 7 34.4% 6 What is the marital status of your parents? 57 responses 15.8% 5.3% Copy Copy 10.5% 21.1% Married Common-law, Divorced Separated Single 47.4% + :) 9:25- Gmail docs.google.com III . BMTM Family Types Survey Questions Responses 61) Settings What is the occupation of your parents? 53 responses 3 3 (5.7%) 2 (3.8%) 2 Copy 3 (5.7%) 2 (3.8%) 1 11:1:1:1:1:1:1 (1111 110111:1:1:1:1:1:1:1:1111111111111. (11111 (19 1 Dentel... Barkery Manag... Gym te... One wo... None dollara... no work bussine... house... singer What is the highest level of education completed by your parents? 59 responses 28.8% + Copy Less than high school High school Some nost :) 9:25- Gmail docs.google.com III . BMTM Family Types Survey Questions Responses 61 Settings What is the highest level of education completed by your parents? 59 responses 35.6% Copy 28.8% 10.2% Less than high school High school Some post- secondary University degree 25.4% How many children do your parents have? 59 responses 16.9% 1 13.6% 2 3 11.9% 4 5 + none :) Copy 9:25- Gmail docs.google.com III BMTM Family Types Survey stions sponses . Responses 61) Settings 16.9% 13.6% 1 2 3 11.9% 4 50 none 6 28.8% 23.7% 7 How often do you see your parents together? 59 responses 22% 10.2% 57.6% + Copy Every day A few times a week A few times a month Once a month N/A Never :) HHS 4C/U "Family Types" Survey Assignment K/U-23 T- 18 C- /6 APP-8 TOTAL- /45 marks Social Scientists often use statistics and graphs to analyze data about human behaviour in our world. For this assignment you will be submitting an outline for a research report using the research process you learned in class. You will be conducting a simple survey consisting of questions in order to compile data about various family types and roles in the family at Bishop Marrocco Thomas Merton C.S.S. Once you have administered your questionnaire, you will be required to compile and analyze your data. You will be using your results to determine whether your sample is representative of the broader Canadian society. See rubric for evaluation criteria. Research Question: Write what question we are trying to answer in this study. What is the prevalence of different family types among students at ,Bishop Marrocco/Thomas Merton Catholic Secondary School and how do these compare to data collected by Census Canada? Hypothesis: (K/U-1 mark) Make a prediction for the results. Do not say "I think..." We hypothesize that our sample population will show a higher percentage of single-parent families and blended families compared to the Census Canada data, which may be due to factors such as changes in societal attitudes towards marriage and divorce, increased mobility and migration, and changing family structures. We hypothesize that there may be variations in family types across different regions and socio-economic groups in Canada, which could be reflected in our findings. Method: (K/U-12 marks) Explain the method you used to collect your data- explain the benefits of this method used by social scientists. Include the link to your questionnaire here. We will conduct a survey using a Google Form to collect data on family types among a sample of students in Canadian schools. We will then compare our findings to data collected by Census Canada on family types. Results: Graph your results on a pie chart and display the results below Analysis: State what your survey showed at Bishop Marrocco Thomas Merton CSS. Secondary Research 1. www.cbc.ca/news/canada/story/2012/09/19/census-data-families-households.html 2. Family Types in Canada 2011 Census Graph. Family Types in Canada 2011 Census same sex,1% blended,5% lone parent, 16% common law,17% married couples,61% Distribution of households by household type, Canada, 2021 Two-or-more- person non-census- family households 4.4% One-person households 29.3% Couple-family households without children 25.6% One-census-family households with additional persons 3.0% One-parent family households 8.7% Multiple-census- family households 0.6% Multigenerational households 2.9% Source(s): Census of Population, 2021 (3901). Couple-family households with children 25.3% State what the results were for all of Canada in 2021 compared to 2011. Was there any change? Select three family types from 2021 census and make comparisons between the numbers of 2011 and 2021. Suggest reasons for any similarities or differences in the numbers between 2011 and 2021 (why?). Now compare the results from 2021 Census Canada to your sample results. Are there any similarities or differences? (6 marks) Family Type #1 2011 2021 Family Type #2 2011 2021 Family Type #3 2011 2021 Explanation for similarities or differences in the numbers between 2011 and 2021 (why?) (2 marks) Family Type Family Type #2 Family Type #3 #1 Your Sample Your Sample Your Sample 2021 2021 2021 Are there similarities or differences in the numbers between your sample and 2021. (2 marks) Conclusions: Does your sample reflect Canadian society overall? Were there any limitations (restrictions, failings) to your study? Was there any bias in the results or changes you would make next time? 9:24- Gmail !!! docs.google.com BMTM Family Types Survey Questions Responses 61 Settings . 20 20 22 ( 36. 1%) 13 ( 21. ... 3 (4.9%) 3 (4.9%) 13 ( 110 21. 5 (8.2%) 3%) 3%) 1 (1.6%) 0 14 15 16 17 18 19 222 22 1 (1.6%) 24 What is your ethnicity? 61 responses Copy American Indian... Asian Pacific Isl... -10 (16.4%) -18 (29.5%) Black or African... -16 (26.2%) Hispanic White/Caucasian Multiple ethnicity... Mixed -12 (19.7%) -15 (24.6%) -6 (9.8%) -3 (4.9%) South Asian -1 (1.6%) Portuguese | (1.6%) Ingigoues Middle eastern -1 (1.6%) indian -1 (1.6%) -1 (1.6%) 0 10 20 20 + :) 9:25- Gmail docs.google.com BMTM Family Types Survey Questions Responses 61 Settings What family function do you value most in the family? 60 responses 20% 21.7% 20% . Copy 10% 21.7% Physical care of members Addition of new members Socialization of children Controlling the behavior of memb... Maintaining morale of members Production & cons... What is your family structure? 60 responses Copy 23.3% 26.7% 31.7% 16.7% Single-parent family Nuclear family Extended family Blended family I live with mom and dad > How many siblings do you have? + Copy :) 9:25- Gmail docs.google.com !!! BMTM Family Types Survey Questions Responses 61 Settings How many siblings do you have? 61 responses 11.5% 1 2 18% 11.5% 3 4 50 . none 13.1% 7 34.4% 6 What is the marital status of your parents? 57 responses 15.8% 5.3% Copy Copy 10.5% 21.1% Married Common-law, Divorced Separated Single 47.4% + :) 9:25- Gmail docs.google.com III . BMTM Family Types Survey Questions Responses 61) Settings What is the occupation of your parents? 53 responses 3 3 (5.7%) 2 (3.8%) 2 Copy 3 (5.7%) 2 (3.8%) 1 11:1:1:1:1:1:1 (1111 110111:1:1:1:1:1:1:1:1111111111111. (11111 (19 1 Dentel... Barkery Manag... Gym te... One wo... None dollara... no work bussine... house... singer What is the highest level of education completed by your parents? 59 responses 28.8% + Copy Less than high school High school Some nost :) 9:25- Gmail docs.google.com III . BMTM Family Types Survey Questions Responses 61 Settings What is the highest level of education completed by your parents? 59 responses 35.6% Copy 28.8% 10.2% Less than high school High school Some post- secondary University degree 25.4% How many children do your parents have? 59 responses 16.9% 1 13.6% 2 3 11.9% 4 5 + none :) Copy 9:25- Gmail docs.google.com III BMTM Family Types Survey stions sponses . Responses 61) Settings 16.9% 13.6% 1 2 3 11.9% 4 50 none 6 28.8% 23.7% 7 How often do you see your parents together? 59 responses 22% 10.2% 57.6% + Copy Every day A few times a week A few times a month Once a month N/A Never :)
Expert Answer:

Posted Date:
Students also viewed these mathematics questions
-
The University of Professional Studies, Accra (UPSA) is a public university in Ghana. UPSA is the first university in Ghana to provide both academic and business professional education. The...
-
Moreno Manufacturing Corporation was started with the issuance of common stock for $30,000. It purchased $7,000 of raw materials and worked on three job orders during 2015 for which data follow....
-
On January 2, 2019, AC Inc. issued 50,000 shares of its no-par-value common stock ($50 stated value) for cash at $51 a share. Give the entry in general journal form to record the issuance of the...
-
Frances Manufacturing makes a product with total unit manufacturing cost of \($64,\) of which \($36\) is variable. No units were on hand at the beginning of 2015. During ax 2015 and 2016, the only...
-
1. What are the risks that eMusic faces if it raises prices? If it does not raise prices? 2. Should eMusic raise its prices using the new tiered pricing schedule? If so, how should the company...
-
d] generates a random number between 3 and 9 Including 3 and 9 5. What are the values talk. and :- a?er executing the following statements? a] k=2,r=2 b] k=6.r=3 e] k=lr=3 d] k=s,r=z {2. Short A
-
A company sells a plant asset that originally cost $360,000 for $120,000 on December 31, 2019. The accumulated depreciation account had a balance of $180,000 after the current year's depreciation of...
-
Build approximations to the definite integral L x dx using several Riemann sums and compare with the exact result. (a) Define the given function . Graph of the function is shown automatically on the...
-
Discuss the principles of fluid instabilities and flow instability mechanisms, including Rayleigh-Taylor instability, Kelvin-Helmholtz instability, and Richtmyer- Meshkov instability, and their role...
-
Sweet Acacia Industries has accounts receivable of $99,200 at March 31, 2024. Credit terms are 2/10, n/30. At March 31, 2024, there is a $2,100 credit balance in Allowance for Doubtful Accounts prior...
-
Explain some of the limitations placed on these rights by citing at least three instances where this has happened. This means finding three cases where the Bill of Rights protections have been...
-
contains only direct materials. Compute the Cost of Goods Manufactured and Cost of Goods Sold for West Nautical Company for the most recent year using the amounts described next. Assume that Raw...
-
On January 1, 2014, the Master Company purchased a machine for $36,000 that had a ten-year estimated useful life and no estimated salvage value. At the start of the seventh year of use, a new energy...
-
Data 9.2 on page 540 introduces the dataset Cereal, which includes information on the number of grams of fiber in a serving for 30 different breakfast cereals. The cereals come from three different...

Study smarter with the SolutionInn App