

Question: Hi, can I please get some help with these questions by looking at the data table? AND Make a graph for table 1 - velocity,
Hi, can I please get some help with these questions by looking at the data table? AND Make a graph for table 1
- velocity, v, vs frequency, f. {Note: variables are identified for graphing as y vs x} On the graph insert a best fit line and display the equation on the graph (title the graph, label the axis with quantity and units). Consider whether the data point (0, 0) should be included on your graph; include the point (0, 0) if it is in agreement with the experiment and relationships between the variables.
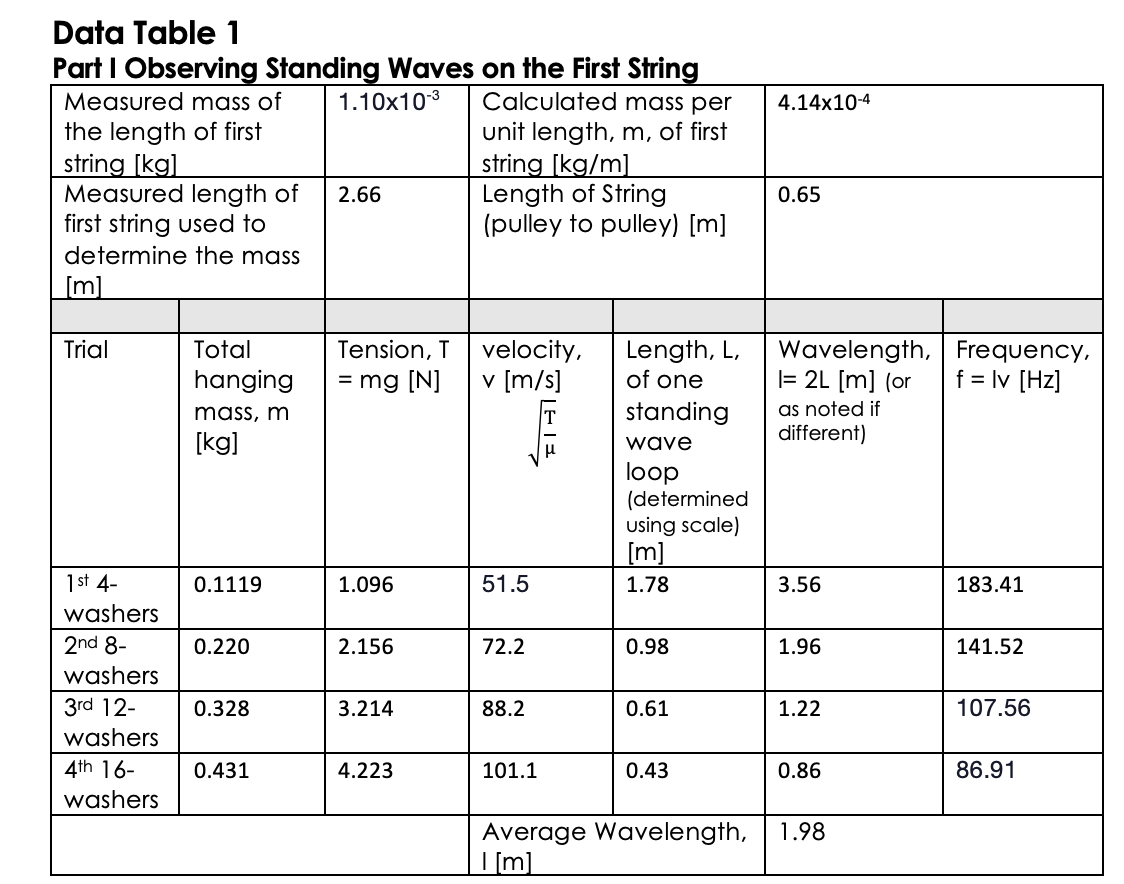
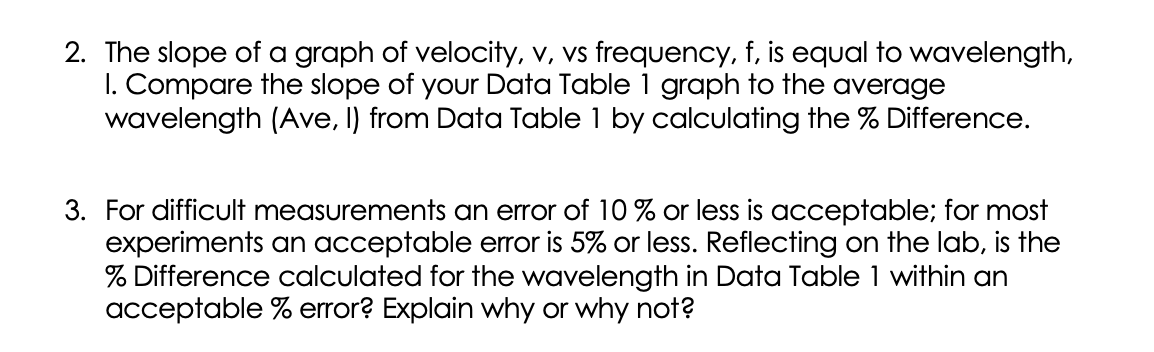
Data Table 1 Part I Observing Standing Waves on the First String Measured mass of 1.10x10⁻³ Calculated mass per 4.14x10⁻⁴ the length of first unit length, m, of first string [kg] string [kg/m] Measured length of 2.66 Length of String 0.65 first string used to (pulley to pulley) [m] determine the mass [m] Trial Total Tension, T velocity, Length, L, Wavelength, Frequency, hanging = mg [N] v [m/s] of one |= 2L [m] (or f = lv [Hz] mass, m standing as noted if [kg] wave different) loop (determined using scale) [m 1 st 4- 0.1119 1.096 51.5 1.78 3.56 183.41 washers 2nd 8- 0.220 2.156 72.2 0.98 1.96 141.52 washers 3rd 12- 0.328 3.214 88.2 0.61 1.22 107.56 washers 4th 16- 0.431 4.223 101.1 0.43 0.86 86.91 washers Average Wavelength, 1.98 I [m]2. The slope of a graph of velocity, v, vs frequency, f, is equal to wavelength, I. Compare the slope of your Data Table 1 graph to the average wavelength (Ave, I) from Data Table 1 by calculating the % Difference. 3. For difficult measurements an error of 10 % or less is acceptable; for most experiments an acceptable error is 5% or less. Reflecting on the lab, is the %% Difference calculated for the wavelength in Data Table 1 within an acceptable % error? Explain why or why not
Step by Step Solution
There are 3 Steps involved in it

Get step-by-step solutions from verified subject matter experts