

Question: Hi, can someone help me with this question? Binomial Distribution (Chapter 4) Open Geogebra and choose Probability Calculator. You can also get to this through
Hi, can someone help me with this question?
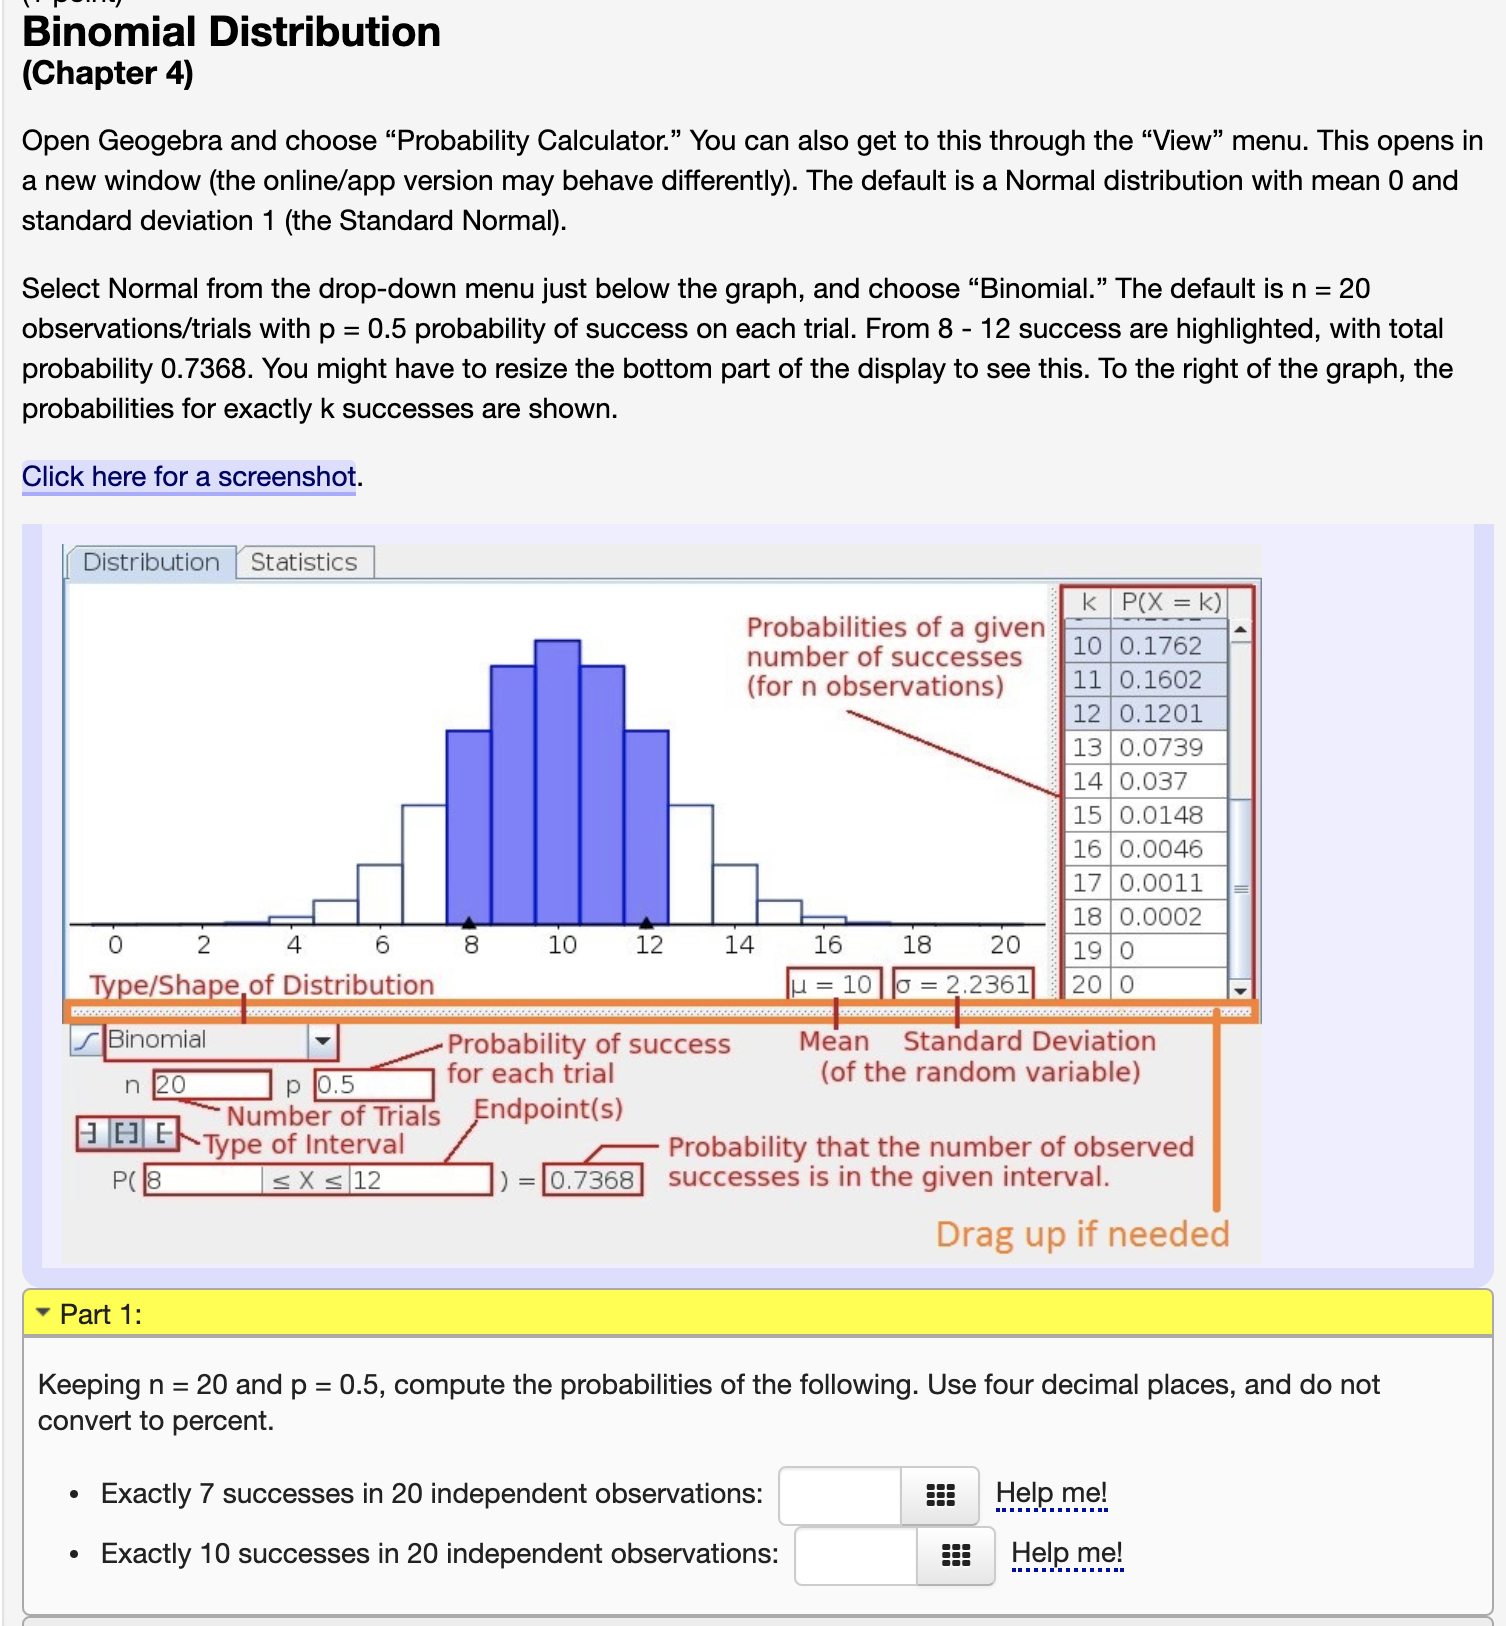
Binomial Distribution (Chapter 4) Open Geogebra and choose "Probability Calculator." You can also get to this through the "View" menu. This opens in a new window (the online/app version may behave differently). The default is a Normal distribution with mean 0 and standard deviation 1 (the Standard Normal). Select Normal from the drop-down menu just below the graph, and choose "Binomial." The default is n = 20 observations/trials with p = 0.5 probability of success on each trial. From 8 - 12 success are highlighted, with total probability 0.7368. You might have to resize the bottom part of the display to see this. To the right of the graph, the probabilities for exactly k successes are shown. Click here for a screenshot. Distribution Statistics Probabilities of a given K P ( X = K) number of successes 10 0.1762 (for n observations) 11 0.1602 12 0.1201 13 0.0739 14 0.037 15 0.0148 16 0.0046 17 0.0011 18 0.0002 0 2 6 8 10 12 14 16 18 20 19 0 Type/Shape of Distribution H = 10 0 = 2.2361 20 0 |Binomial Probability of success Mean Standard Deviation 20 p 0.5 for each trial (of the random variable) ~ Number of Trials 3 6] E - Type of Interval Endpoint(s) Probability that the number of observed P( 8 SX s 12 = 0.7368 successes is in the given interval. Drag up if needed Part 1: Keeping n = 20 and p = 0.5, compute the probabilities of the following. Use four decimal places, and do not convert to percent. . Exactly 7 successes in 20 independent observations: Help me! . Exactly 10 successes in 20 independent observations: Help me
Step by Step Solution
There are 3 Steps involved in it

Get step-by-step solutions from verified subject matter experts