Question: Hi can someone please help me with this problem for math class please? I am stuck only on part 3 for the math problem. Please
Hi can someone please help me with this problem for math class please? I am stuck only on part 3 for the math problem. Please show work and explain your answers, and let me know in the comments if additional information is required. Thank you.
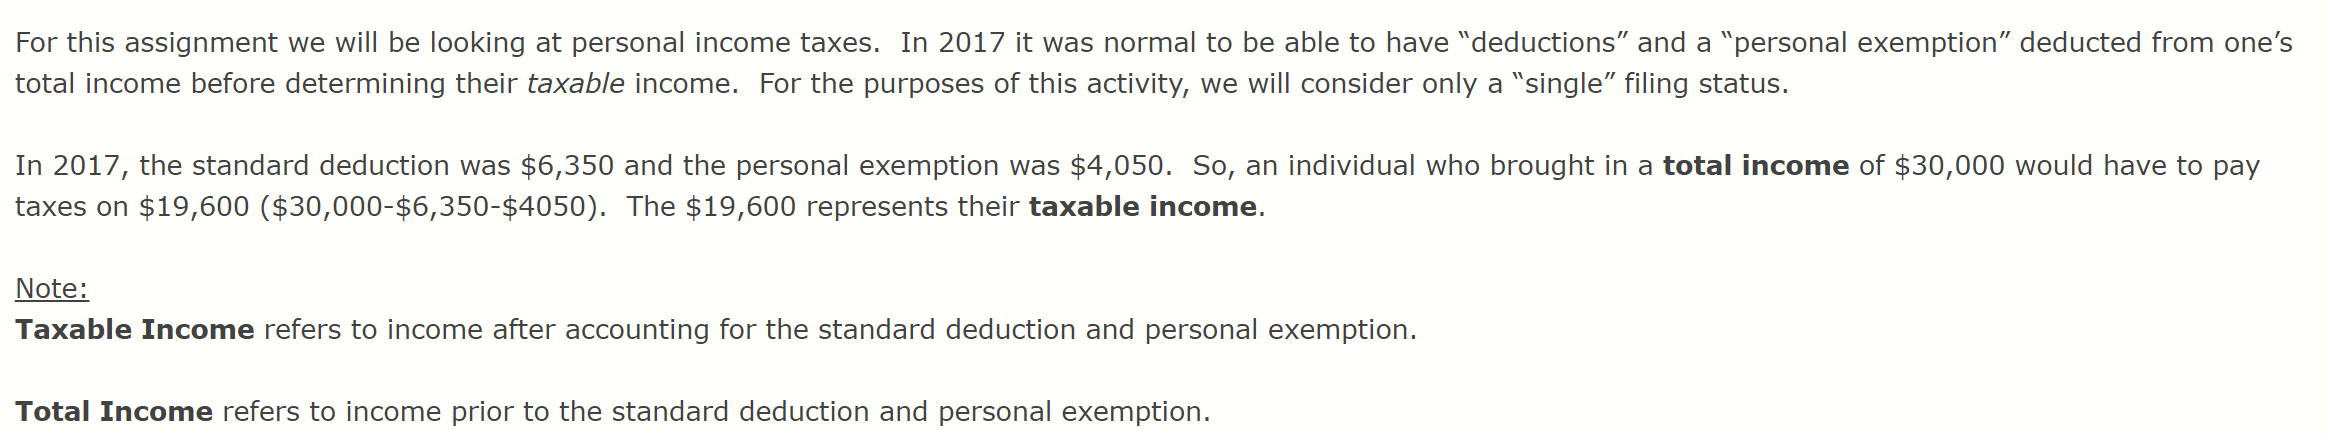
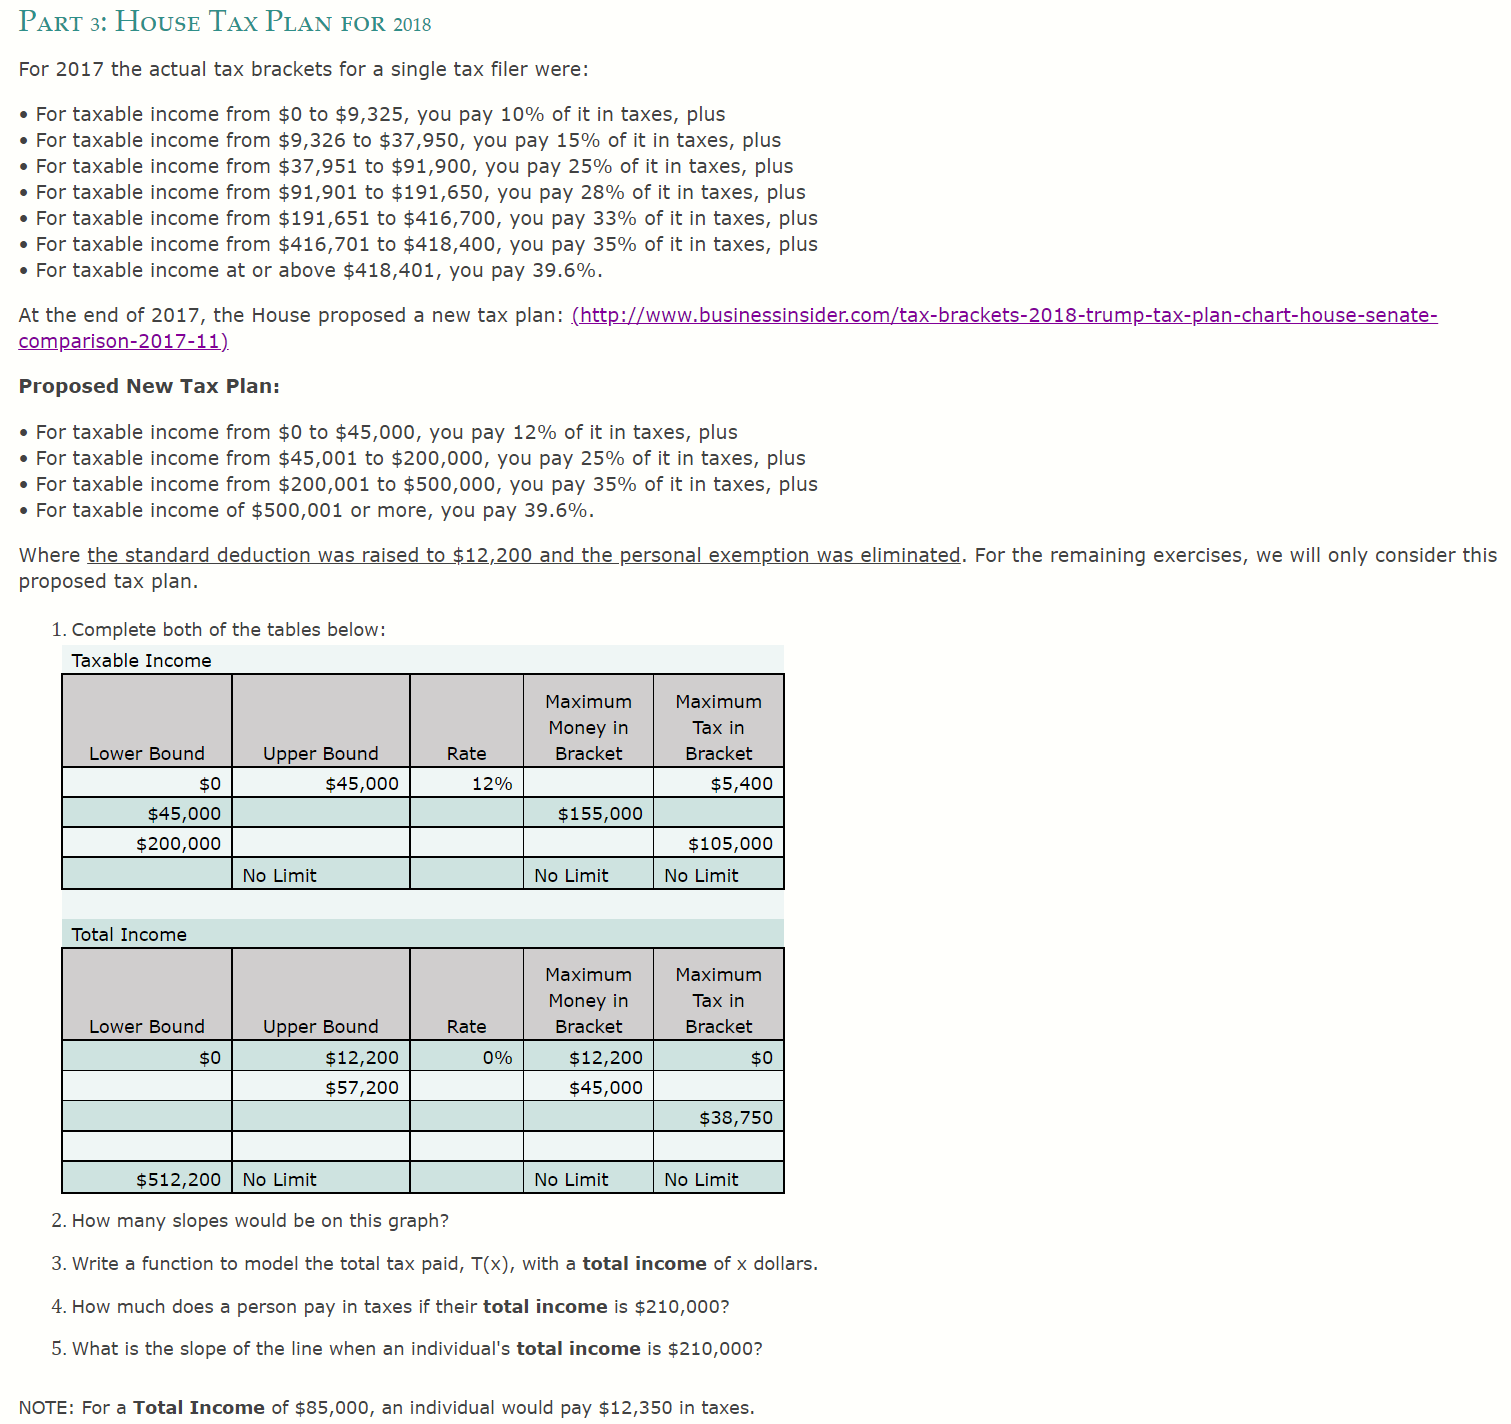
For this assignment we will be looking at personal income taxes. In 2017 it was normal to be able to have \"deductions\" and a \"personal exemption" deducted from one's total income before determining their taxable income. For the purposes of this activity, we will consider only a \"single" filing status. In 2017, the standard deduction was $6,350 and the personal exemption was $4,050. 50, an individual who brought in a total income of $30,000 would have to pay taxes on $19,600 ($30,000-$6,350-$4050). The $19,600 represents their taxable income. Note: Taxable Income refers to income after accounting for the standard deduction and personal exemption. Total Income refers to income prior to the standard deduction and personal exemption. PART 3: HOUSE TAX PLAN FOR 2018 For 2017 the actual tax brackets for a single tax filer were: . For taxable income from $0 to $9,325, you pay 10% of it in taxes, plus For taxable income from $9,326 to $37,950, you pay 15% of it in taxes, plus . For taxable income from $37,951 to $91,900, you pay 25% of it in taxes, plus . For taxable income from $91,901 to $191,650, you pay 28% of it in taxes, plus For taxable income from $191,651 to $416,700, you pay 33% of it in taxes, plus . For taxable income from $416,701 to $418,400, you pay 35% of it in taxes, plus . For taxable income at or above $418,401, you pay 39.6%. At the end of 2017, the House proposed a new tax plan: (http://www.businessinsider.com/tax-brackets-2018-trump-tax-plan-chart-house-senate- comparison-2017-11) Proposed New Tax Plan: . For taxable income from $0 to $45,000, you pay 12% of it in taxes, plus . For taxable income from $45,001 to $200,000, you pay 25% of it in taxes, plus . For taxable income from $200,001 to $500,000, you pay 35% of it in taxes, plus . For taxable income of $500,001 or more, you pay 39.6%. Where the standard deduction was raised to $12,200 and the personal exemption was eliminated. For the remaining exercises, we will only consider this proposed tax plan. 1. Complete both of the tables below: Taxable Income Maximum Maximum Money in Tax in Lower Bound Upper Bound Rate Bracket Bracket $0 $45,000 12% $5,400 $45,000 $155,000 $200,000 105,000 No Limit No Limit No Limit Total Income Maximum Maximum Money in Tax in Lower Bound Upper Bound Rate Bracket Bracket $0 $12,200 0% $12,200 $0 $57,200 $45,000 $38,750 $512,200 No Limit No Limit No Limit 2. How many slopes would be on this graph? 3. Write a function to model the total tax paid, T(x), with a total income of x dollars. 4. How much does a person pay in taxes if their total income is $210,000? 5. What is the slope of the line when an individual's total income is $210,000? NOTE: For a Total Income of $85,000, an individual would pay $12,350 in taxes