

Question: hi can you help me with this question BETA G docs.google.com ( ) C Suzy Lu is in BIG trouble... - YouTube Assignment 4(1) -
hi can you help me with this question
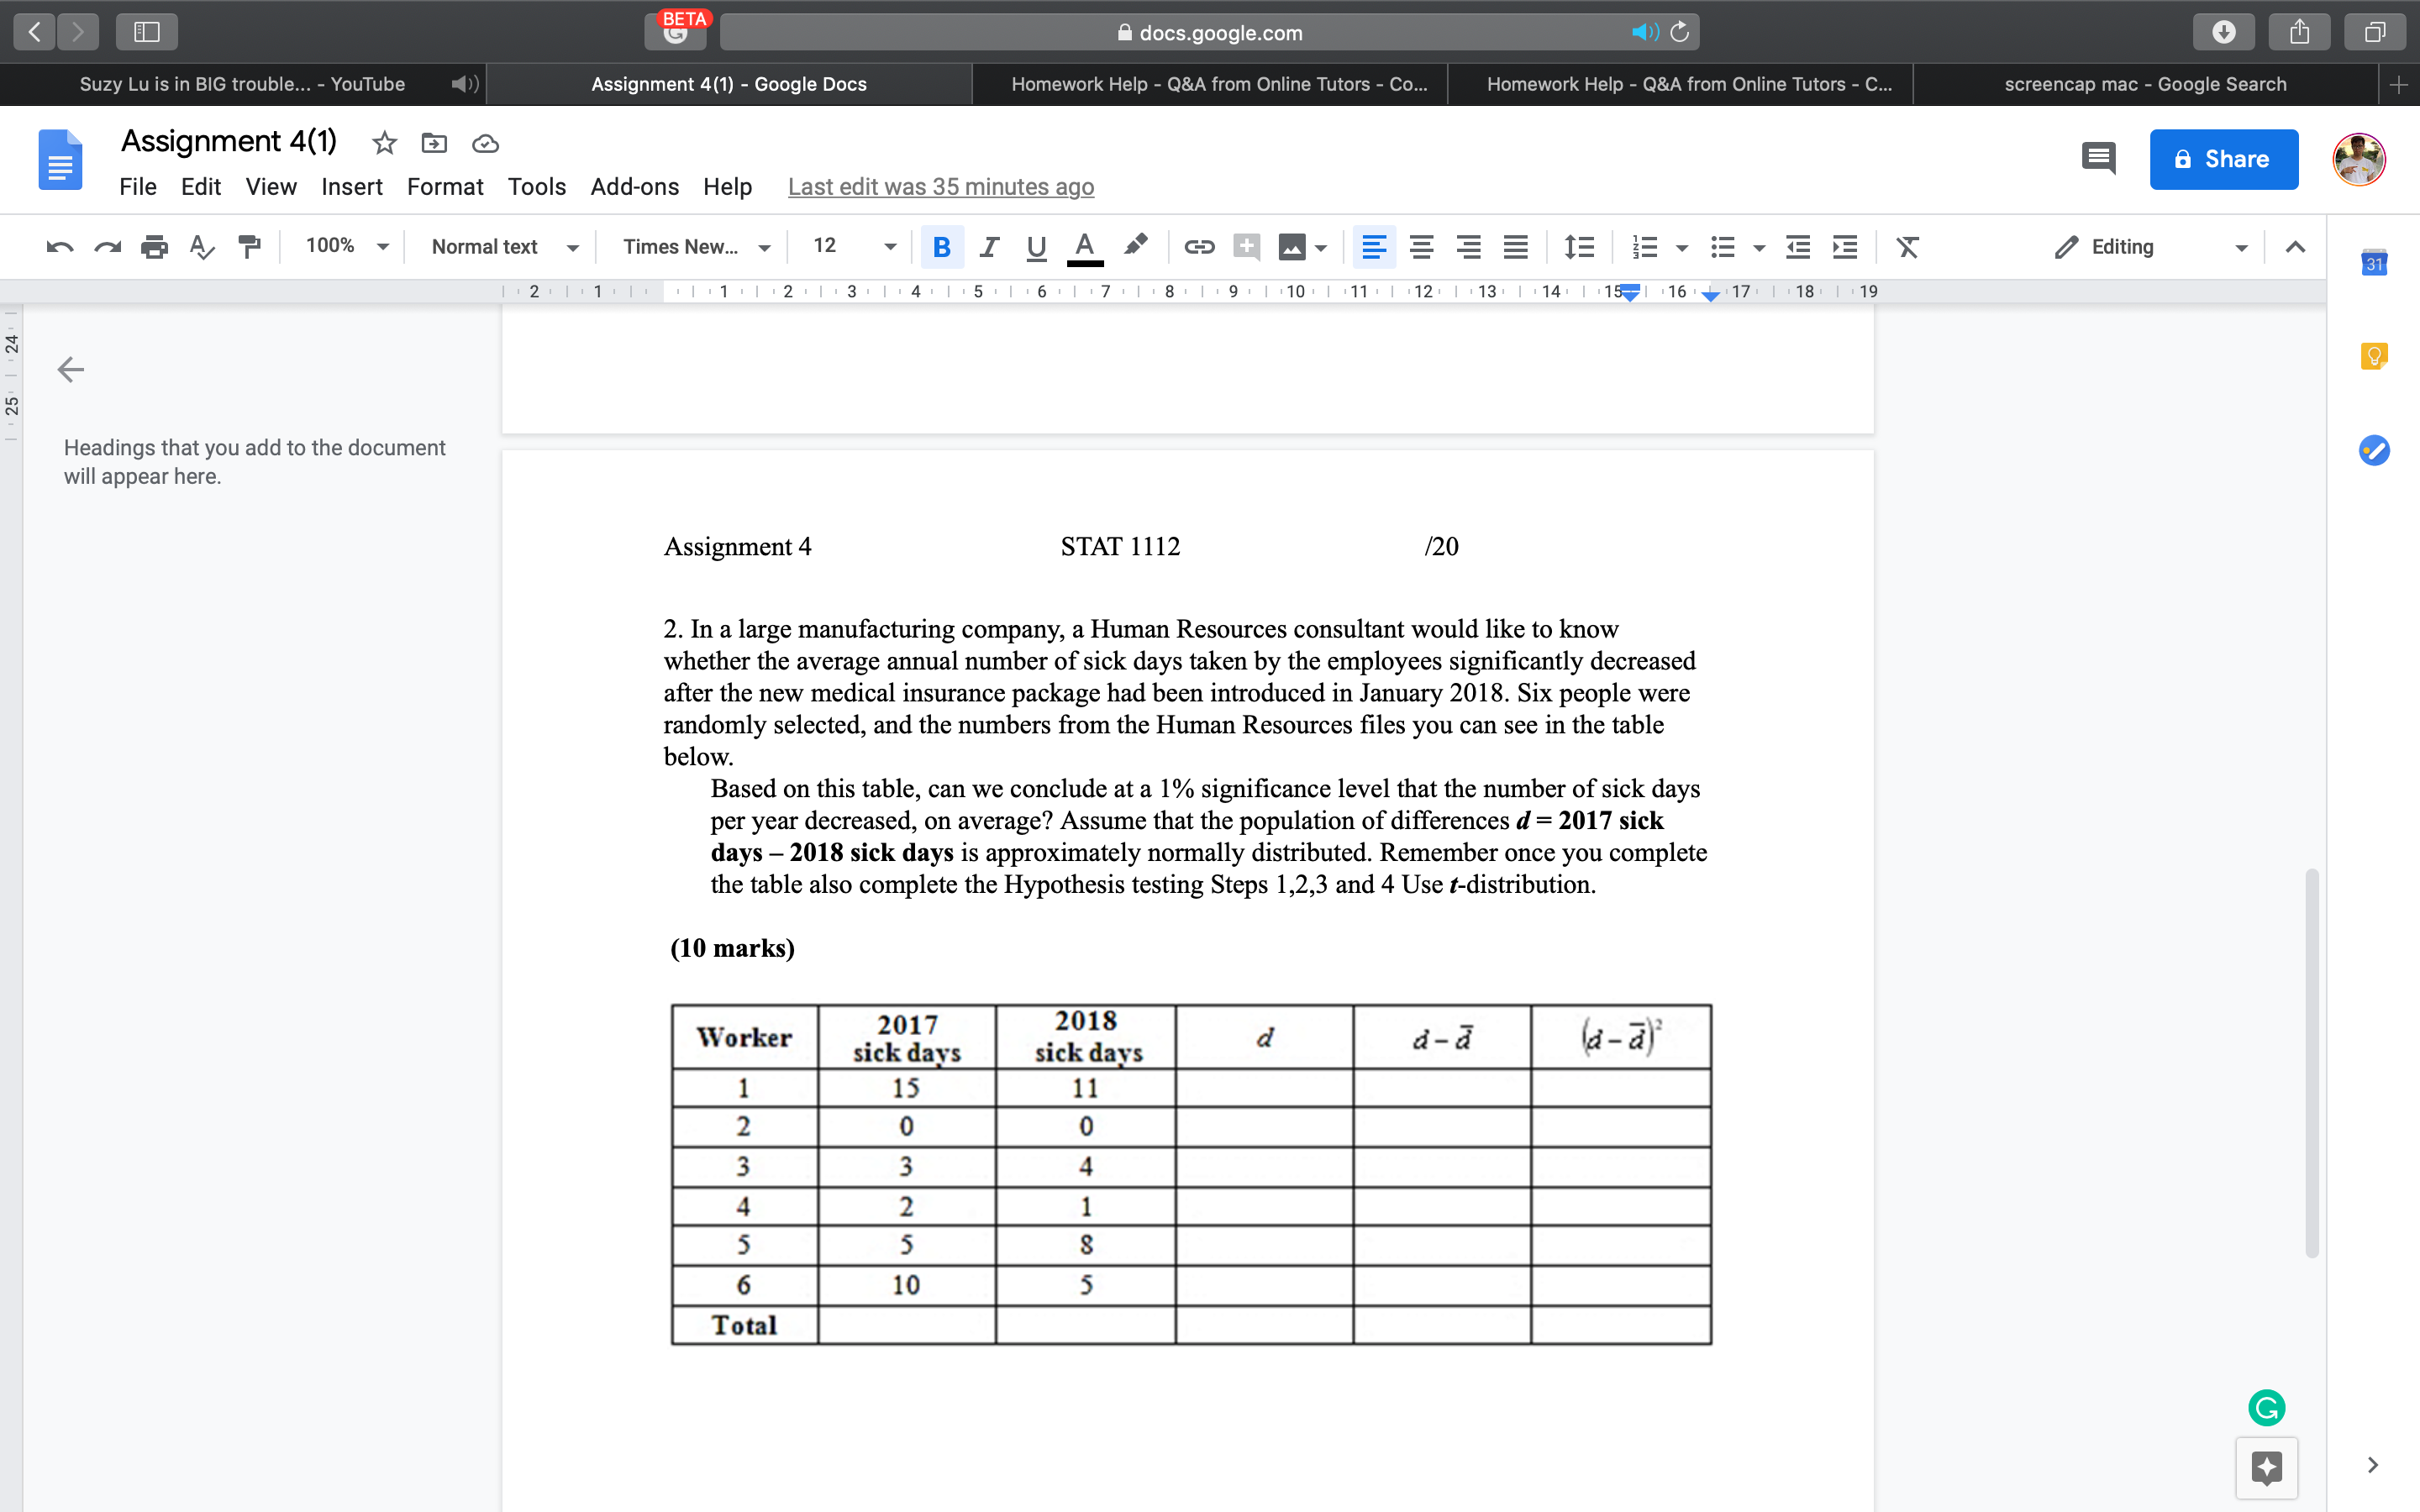
BETA G docs.google.com ( ) C Suzy Lu is in BIG trouble... - YouTube Assignment 4(1) - Google Docs Homework Help - Q&A from Online Tutors - Co... Homework Help - Q&A from Online Tutors - C... screencap mac - Google Search S Assignment 4(1) * & Share File Edit View Insert Format Tools Add-ons Help Last edit was 35 minutes ago n a $ 7 100% Normal text Times New... 12 Editing A 1 2 . 1 1 7 . 1 1 1 1 1 1 . 1 1 2 . 1 1 3 1 1 1 4 1 1 1 5 . 1 1 6 . 1 1 7 . 1 1 8 1 9 . 1 10 1 17 . 1 12 1 13 1 14 1 15 1 16 17 1 18 1 19 Headings that you add to the document will appear here. Assignment 4 STAT 1112 120 2. In a large manufacturing company, a Human Resources consultant would like to know whether the average annual number of sick days taken by the employees significantly decreased after the new medical insurance package had been introduced in January 2018. Six people were randomly selected, and the numbers from the Human Resources files you can see in the table below. Based on this table, can we conclude at a 1% significance level that the number of sick days per year decreased, on average? Assume that the population of differences d = 2017 sick days - 2018 sick days is approximately normally distributed. Remember once you complete the table also complete the Hypothesis testing Steps 1,2,3 and 4 Use t-distribution. (10 marks) Worker 2017 2018 sick days sick days d a- a (a - 2) 1 15 11 UAW N 0 0 3 2 5 6 10 Co - 5 Total G +
Step by Step Solution
There are 3 Steps involved in it

Get step-by-step solutions from verified subject matter experts