

Question: Hi, can you please help me with these math questions. I have chosen Gold and here is the graph and the lowest point is March
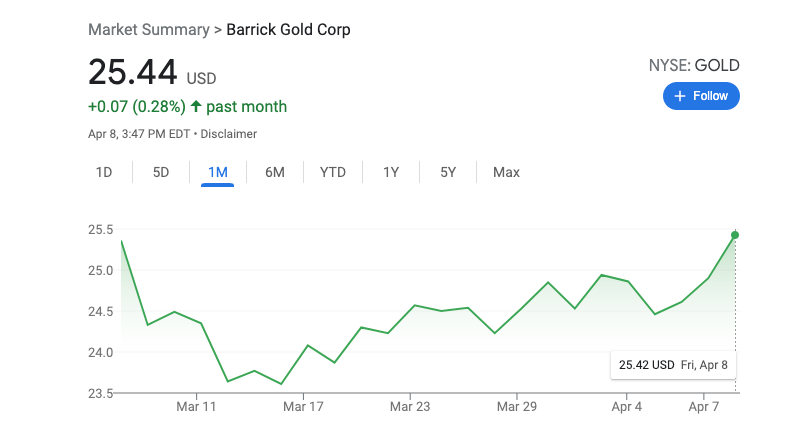
Hi, can you please help me with these math questions. I have chosen Gold and here is the graph and the lowest point is March 14, 2022 $23.64 and highest point April 8, 2022 $25.42.
Question one: Post a picture of the graph of your favorite stock's price-it can be a one month graph, 6 month, 5 year.
Question two: Use the picture you posted to find a time period where the graph is concave up-you can draw on your graph as well as clearly state the interval here.
Question three: Use the picture you posted to find a time period where the graph is concave down-you can draw on your graph as well as clearly state the interval here.
Question four: Are there any obvious inflection points? If so, write the coordinates of the inflection point as an ordered pair.
Step by Step Solution
There are 3 Steps involved in it

Get step-by-step solutions from verified subject matter experts