

Question: Hi, can you please solve this and explain your approach? Thanks. The general manager at Sweety Inc. wants to improve the sugar refining, production, and
Hi, can you please solve this and explain your approach? Thanks. 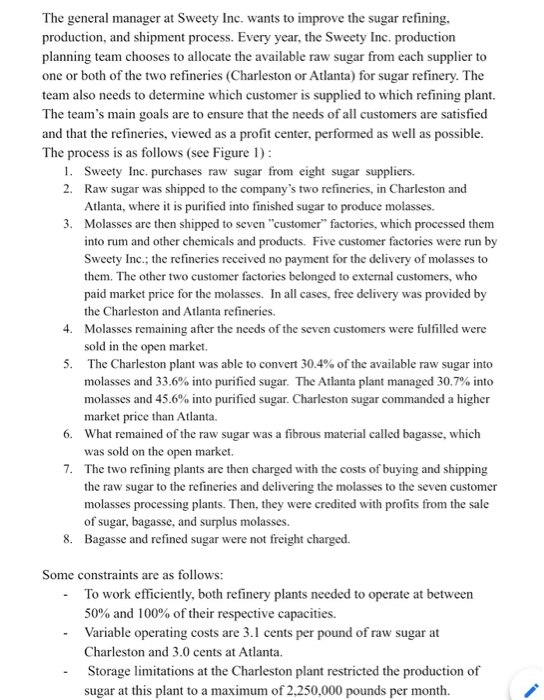
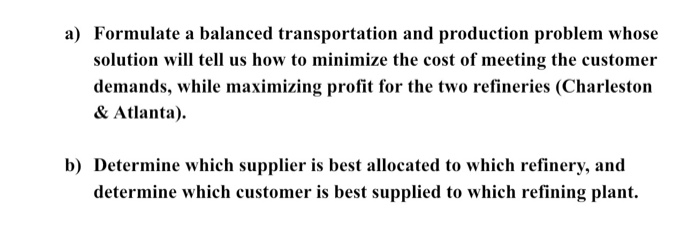
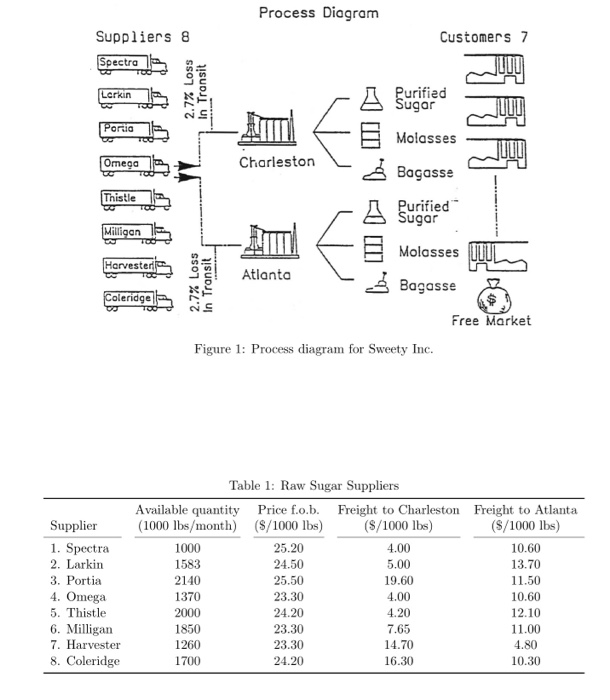
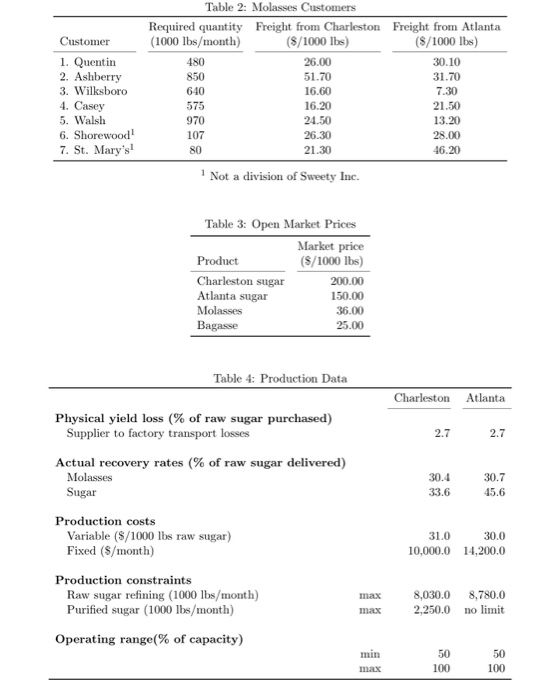
The general manager at Sweety Inc. wants to improve the sugar refining, production, and shipment process. Every year, the Sweety Inc. production planning team chooses to allocate the available raw sugar from each supplier to one or both of the two refineries (Charleston or Atlanta) for sugar refinery. The team also needs to determine which customer is supplied to which refining plant. The team's main goals are to ensure that the needs of all customers are satisfied and that the refineries, viewed as a profit center, performed as well as possible. The process is as follows (see Figure 1): 1. Sweety Inc. purchases raw sugar from eight sugar suppliers. 2. Raw sugar was shipped to the company's two refineries, in Charleston and Atlanta, where it is purified into finished sugar to produce molasses. 3. Molasses are then shipped to seven "customer factories, which processed them into rum and other chemicals and products. Five customer factories were run by Sweety Inc.; the refineries received no payment for the delivery of molasses to them. The other two customer factories belonged to external customers, who paid market price for the molasses. In all cases, free delivery was provided by the Charleston and Atlanta refineries. 4. Molasses remaining after the needs of the seven customers were fulfilled were sold in the open market. 5. The Charleston plant was able to convert 30.4% of the available raw sugar into molasses and 33.6% into purified sugar. The Atlanta plant managed 30.7% into molasses and 45.6% into purified sugar. Charleston sugar commanded a higher market price than Atlanta. 6. What remained of the raw sugar was a fibrous material called bagasse, which was sold on the open market. 7. The two refining plants are then charged with the costs of buying and shipping the raw sugar to the refineries and delivering the molasses to the seven customer molasses processing plants. Then, they were credited with profits from the sale of sugar, bagasse, and surplus molasses. 8. Bagasse and refined sugar were not freight charged. Some constraints are as follows: To work efficiently, both refinery plants needed to operate at between 50% and 100% of their respective capacities. Variable operating costs are 3.1 cents per pound of raw sugar at Charleston and 3.0 cents at Atlanta. Storage limitations at the Charleston plant restricted the production of sugar at this plant to a maximum of 2,250,000 pounds per month. a) Formulate a balanced transportation and production problem whose solution will tell us how to minimize the cost of meeting the customer demands, while maximizing profit for the two refineries (Charleston & Atlanta). b) Determine which supplier is best allocated to which refinery, and determine which customer is best supplied to which refining plant. Process Diagram Customers 7 Suppliers 8 Spectra 15 Larkin 2.7% Loss In Transit Purified 10gr Porua Molasses Omega Charleston Do, Bacasse Thistle Purified Sugar Milliqan 5 Harvester A LI Molasses ulls 2.7% Loss In Transit Atlanta [ Bagasse Coleridges Free Market Figure 1: Process diagram for Sweety Inc. Supplier 1. Spectra 2. Larkin 3. Portia 4. Omega 5. Thistle 6. Milligan 7. Harvester 8. Coleridge Table 1: Raw Sugar Suppliers Available quantity Price f.o.b. Freight to Charleston (1000 lbs/month) (8/1000 lbs) (8/1000 lbs) 1000 25.20 4.00 1583 24.50 5.00 2140 25.50 19.60 1370 23.30 4.00 2000 24.20 4.20 1850 23.30 7.65 1260 23.30 14.70 1700 24.20 16.30 Freight to Atlanta (S/1000 lbs) 10.60 13.70 11.50 10.60 12.10 11.00 4.80 10.30 Customer 1. Quentin 2. Ashberry 3. Wilksboro 4. Casey 5. Walsh 6. Shorewood 7. St. Mary's! Table 2: Molasses Customers Required quantity Freight from Charleston Freight from Atlanta (1000 lbs/month) (S/1000 lbs) (8/1000 lbs) 480 26.00 30.10 850 51.70 31.70 640 16.60 7.30 16.20 21.50 970 24.50 13.20 107 26.30 28.00 21.30 46.20 575 Not a division of Sweety Inc. Table 3: Open Market Prices Product Charleston sugar Atlanta sugar Molasses Bagasse Market price (S/1000 lbs) 200.00 150.00 36.00 25.00 Table 4: Production Data Charleston Atlanta Physical yield loss (% of raw sugar purchased) Supplier to factory transport losses 2.7 Actual recovery rates (% of raw sugar delivered) Molasses Sugar 30.4 33.6 30.7 45.6 Production costs Variable ($/1000 lbs raw sugar) Fixed ($/month) 31.0 10,000.0 30.0 14,200.0 Production constraints Raw sugar refining (1000 lbs/month) Purified sugar (1000 lbs/month) max max 8,030.0 2.250.0 8,780.0 no limit Operating range(% of capacity) 50 100 50 100 The general manager at Sweety Inc. wants to improve the sugar refining, production, and shipment process. Every year, the Sweety Inc. production planning team chooses to allocate the available raw sugar from each supplier to one or both of the two refineries (Charleston or Atlanta) for sugar refinery. The team also needs to determine which customer is supplied to which refining plant. The team's main goals are to ensure that the needs of all customers are satisfied and that the refineries, viewed as a profit center, performed as well as possible. The process is as follows (see Figure 1): 1. Sweety Inc. purchases raw sugar from eight sugar suppliers. 2. Raw sugar was shipped to the company's two refineries, in Charleston and Atlanta, where it is purified into finished sugar to produce molasses. 3. Molasses are then shipped to seven "customer factories, which processed them into rum and other chemicals and products. Five customer factories were run by Sweety Inc.; the refineries received no payment for the delivery of molasses to them. The other two customer factories belonged to external customers, who paid market price for the molasses. In all cases, free delivery was provided by the Charleston and Atlanta refineries. 4. Molasses remaining after the needs of the seven customers were fulfilled were sold in the open market. 5. The Charleston plant was able to convert 30.4% of the available raw sugar into molasses and 33.6% into purified sugar. The Atlanta plant managed 30.7% into molasses and 45.6% into purified sugar. Charleston sugar commanded a higher market price than Atlanta. 6. What remained of the raw sugar was a fibrous material called bagasse, which was sold on the open market. 7. The two refining plants are then charged with the costs of buying and shipping the raw sugar to the refineries and delivering the molasses to the seven customer molasses processing plants. Then, they were credited with profits from the sale of sugar, bagasse, and surplus molasses. 8. Bagasse and refined sugar were not freight charged. Some constraints are as follows: To work efficiently, both refinery plants needed to operate at between 50% and 100% of their respective capacities. Variable operating costs are 3.1 cents per pound of raw sugar at Charleston and 3.0 cents at Atlanta. Storage limitations at the Charleston plant restricted the production of sugar at this plant to a maximum of 2,250,000 pounds per month. a) Formulate a balanced transportation and production problem whose solution will tell us how to minimize the cost of meeting the customer demands, while maximizing profit for the two refineries (Charleston & Atlanta). b) Determine which supplier is best allocated to which refinery, and determine which customer is best supplied to which refining plant. Process Diagram Customers 7 Suppliers 8 Spectra 15 Larkin 2.7% Loss In Transit Purified 10gr Porua Molasses Omega Charleston Do, Bacasse Thistle Purified Sugar Milliqan 5 Harvester A LI Molasses ulls 2.7% Loss In Transit Atlanta [ Bagasse Coleridges Free Market Figure 1: Process diagram for Sweety Inc. Supplier 1. Spectra 2. Larkin 3. Portia 4. Omega 5. Thistle 6. Milligan 7. Harvester 8. Coleridge Table 1: Raw Sugar Suppliers Available quantity Price f.o.b. Freight to Charleston (1000 lbs/month) (8/1000 lbs) (8/1000 lbs) 1000 25.20 4.00 1583 24.50 5.00 2140 25.50 19.60 1370 23.30 4.00 2000 24.20 4.20 1850 23.30 7.65 1260 23.30 14.70 1700 24.20 16.30 Freight to Atlanta (S/1000 lbs) 10.60 13.70 11.50 10.60 12.10 11.00 4.80 10.30 Customer 1. Quentin 2. Ashberry 3. Wilksboro 4. Casey 5. Walsh 6. Shorewood 7. St. Mary's! Table 2: Molasses Customers Required quantity Freight from Charleston Freight from Atlanta (1000 lbs/month) (S/1000 lbs) (8/1000 lbs) 480 26.00 30.10 850 51.70 31.70 640 16.60 7.30 16.20 21.50 970 24.50 13.20 107 26.30 28.00 21.30 46.20 575 Not a division of Sweety Inc. Table 3: Open Market Prices Product Charleston sugar Atlanta sugar Molasses Bagasse Market price (S/1000 lbs) 200.00 150.00 36.00 25.00 Table 4: Production Data Charleston Atlanta Physical yield loss (% of raw sugar purchased) Supplier to factory transport losses 2.7 Actual recovery rates (% of raw sugar delivered) Molasses Sugar 30.4 33.6 30.7 45.6 Production costs Variable ($/1000 lbs raw sugar) Fixed ($/month) 31.0 10,000.0 30.0 14,200.0 Production constraints Raw sugar refining (1000 lbs/month) Purified sugar (1000 lbs/month) max max 8,030.0 2.250.0 8,780.0 no limit Operating range(% of capacity) 50 100 50 100 Step by Step Solution
There are 3 Steps involved in it
1 Expert Approved Answer
Step: 1 Unlock

Question Has Been Solved by an Expert!
Get step-by-step solutions from verified subject matter experts
Step: 2 Unlock
Step: 3 Unlock