

Question: Hi could i have help with this multiple choice The diagram shows the demand and the supply curves for secondhand textbooks. $25 $20 Demand curve
Hi could i have help with this multiple choice
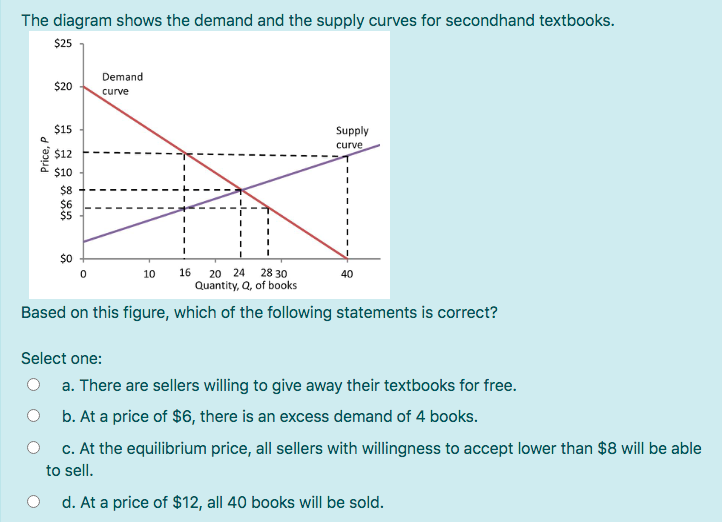
The diagram shows the demand and the supply curves for secondhand textbooks. $25 $20 Demand curve $15 Supply $12 curve a $10 $6 0 10 16 20 24 28 30 40 Quantity, Q, of books Based on this figure, which of the following statements is correct? Select one: O a. There are sellers willing to give away their textbooks for free. O b. At a price of $6, there is an excess demand of 4 books. O c. At the equilibrium price, all sellers with willingness to accept lower than $8 will be able to sell. O d. At a price of $12, all 40 books will be sold
Step by Step Solution
There are 3 Steps involved in it
1 Expert Approved Answer
Step: 1 Unlock

Question Has Been Solved by an Expert!
Get step-by-step solutions from verified subject matter experts
Step: 2 Unlock
Step: 3 Unlock