

Question: Hi, could i please have help with this question QUESTION 4 [ Max 150 words, 5 marks] Figure 2 shows gross domestic product per capita
Hi, could i please have help with this question
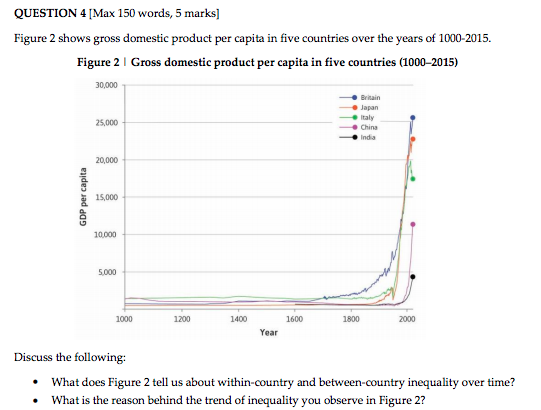
QUESTION 4 [ Max 150 words, 5 marks] Figure 2 shows gross domestic product per capita in five countries over the years of 1000-2015. Figure 2 | Gross domestic product per capita in five countries (1000-2015) 30,000 Britain Japan 25,000 Italy China India 20,000 GDP per capita 15,000 10.000 5.000 1000 1200 1400 1600 1800 2000 Year Discuss the following: . What does Figure 2 tell us about within-country and between-country inequality over time? What is the reason behind the trend of inequality you observe in Figure 2
Step by Step Solution
There are 3 Steps involved in it
1 Expert Approved Answer
Step: 1 Unlock

Question Has Been Solved by an Expert!
Get step-by-step solutions from verified subject matter experts
Step: 2 Unlock
Step: 3 Unlock