

Question: Hi Course Hero, I am having issues trying to solve the problem below. I have pasted the question below which includes a graph. 4. Equilibrium
Hi Course Hero,
I am having issues trying to solve the problem below. I have pasted the question below which includes a graph.
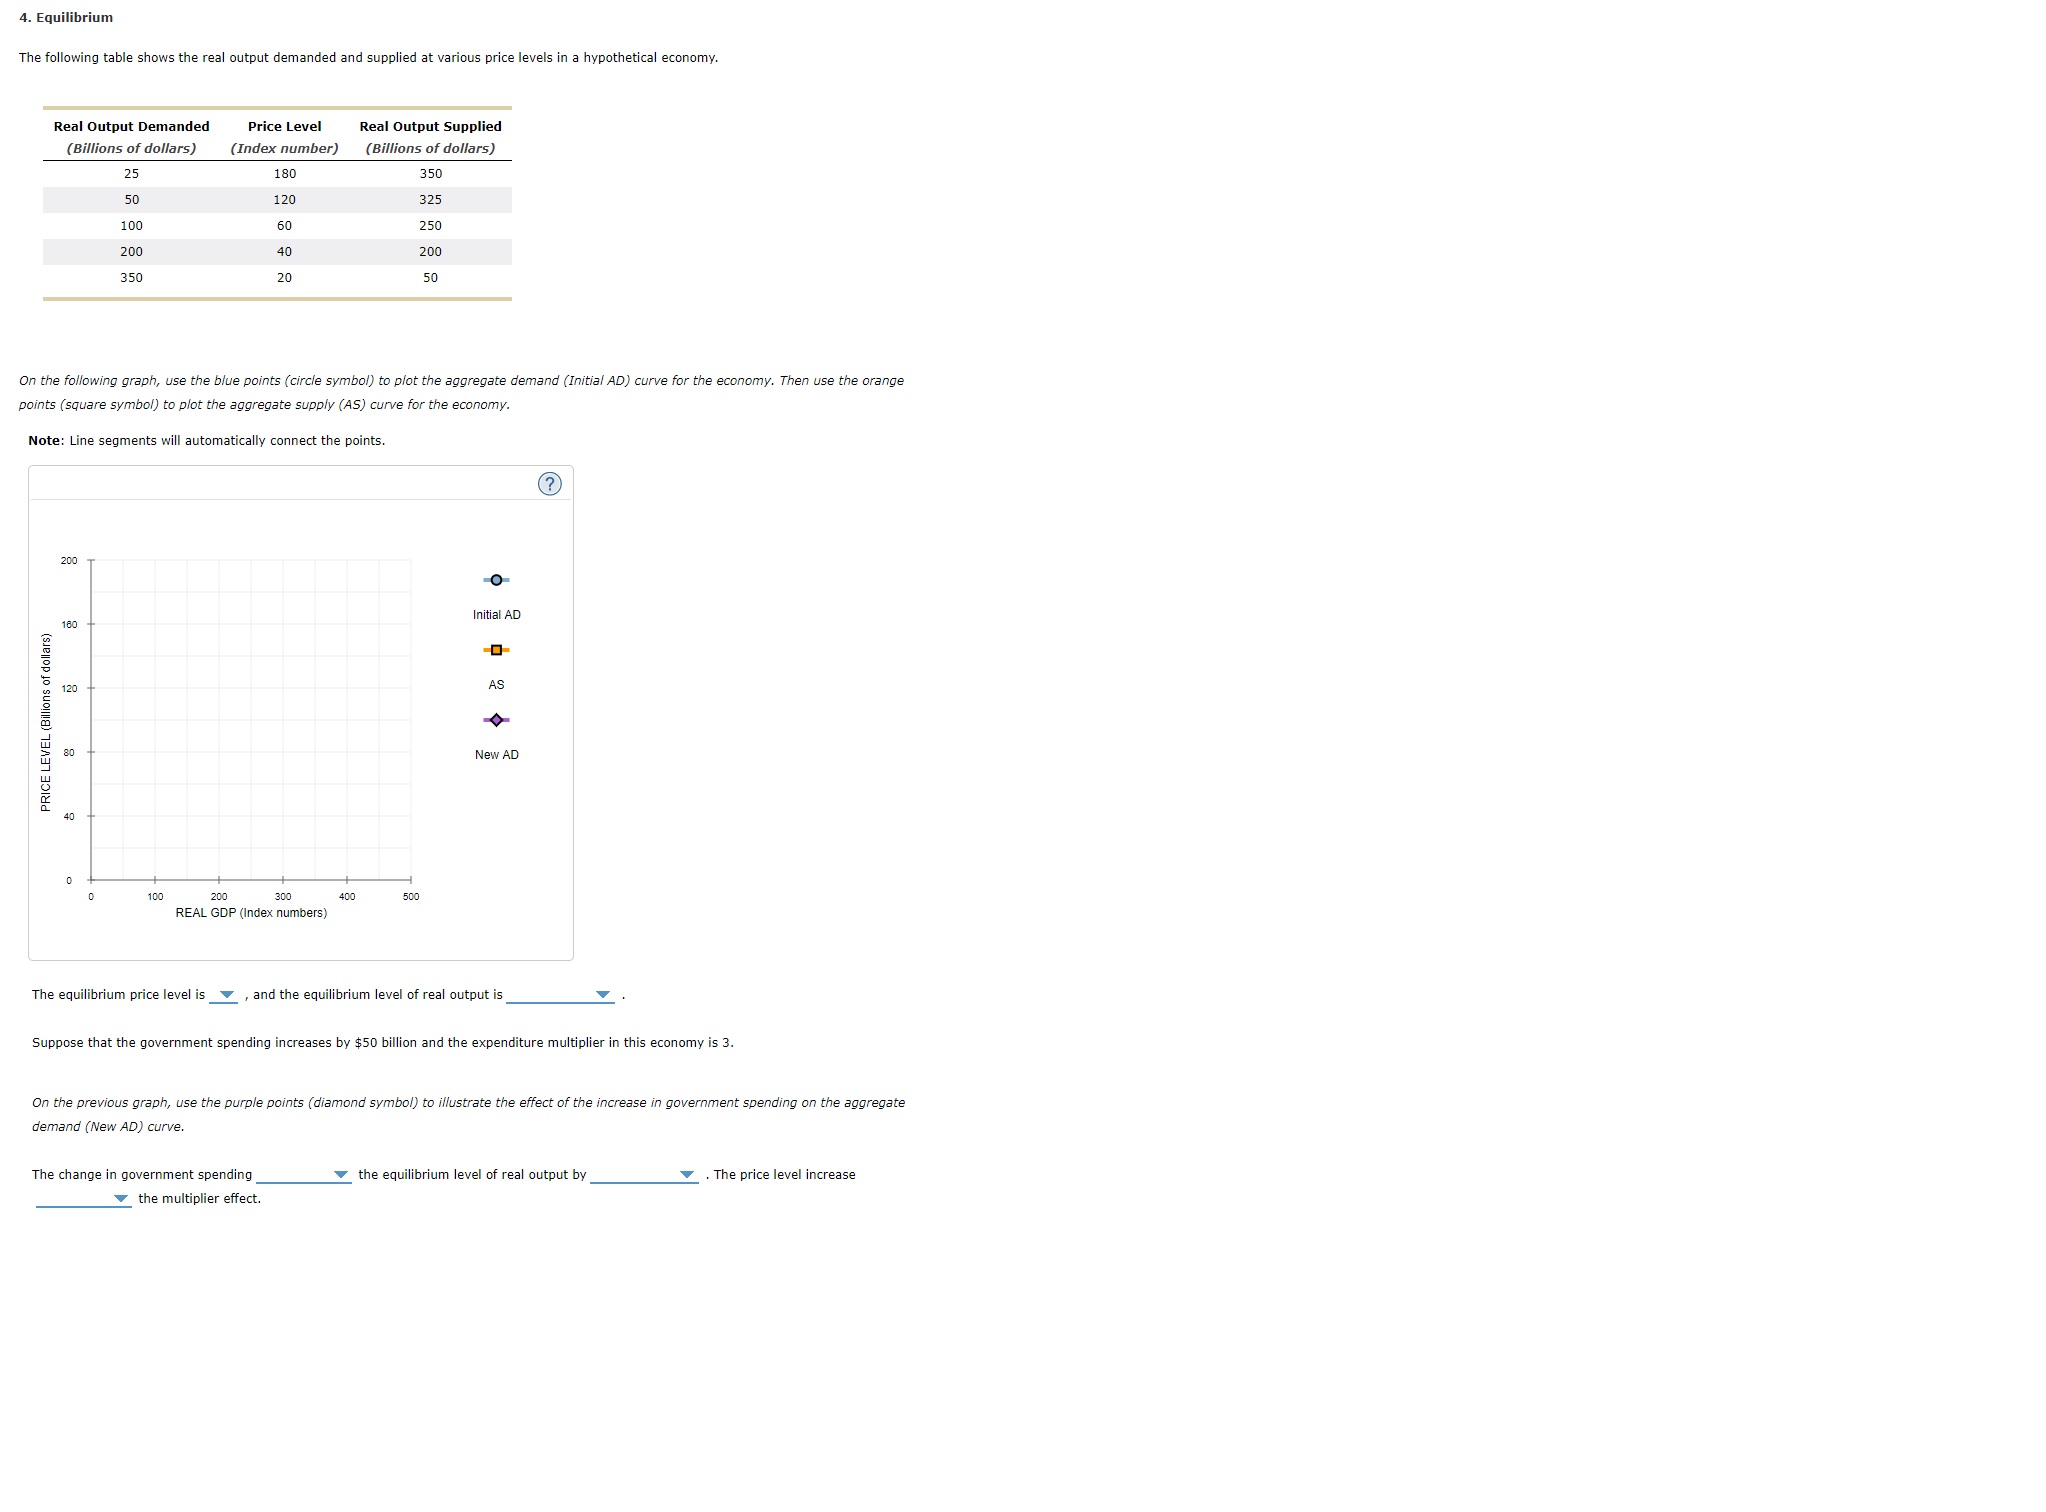
4. Equilibrium The following table shows the real output demanded and supplied at various price levels in a hypothetical economy. Real Output Demanded Price Level Real Output Supplied (Billions of dollars) (Index number) (Billions of dollars) 25 180 350 50 120 325 100 60 250 200 40 200 350 20 50 On the following graph, use the blue points (circle symbol) to plot the aggregate demand (Initial AD) curve for the economy. Then use the orange points (square symbol) to plot the aggregate supply (AS) curve for the economy. Note: Line segments will automatically connect the points. (?) 200 180 Initial AD PRICE LEVEL (Billions of dollars) 120 AS 8 New AD 100 200 300 400 500 REAL GDP (Index numbers) The equilibrium price level is _, and the equilibrium level of real output is Suppose that the government spending increases by $50 billion and the expenditure multiplier in this economy is 3. On the previous graph, use the purple points (diamond symbol) to illustrate the effect of the increase in government spending on the aggregate demand (New AD) curve. The change in government spending the equilibrium level of real output by . The price level increase the multiplier effect
Step by Step Solution
There are 3 Steps involved in it

Get step-by-step solutions from verified subject matter experts