

Question: ,, Hi expert solve this Consider the following models describing the relationship between monthly return on the Standard & Poor's 500 stock market index (rsp500),
,, Hi expert solve this
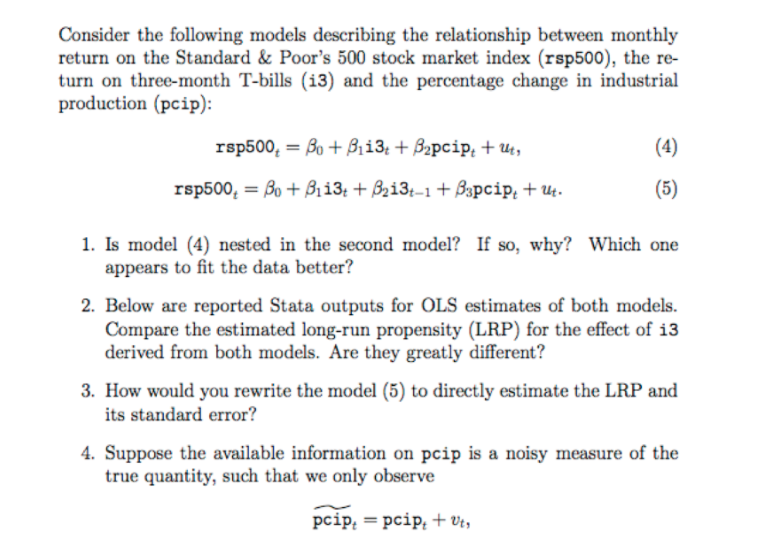
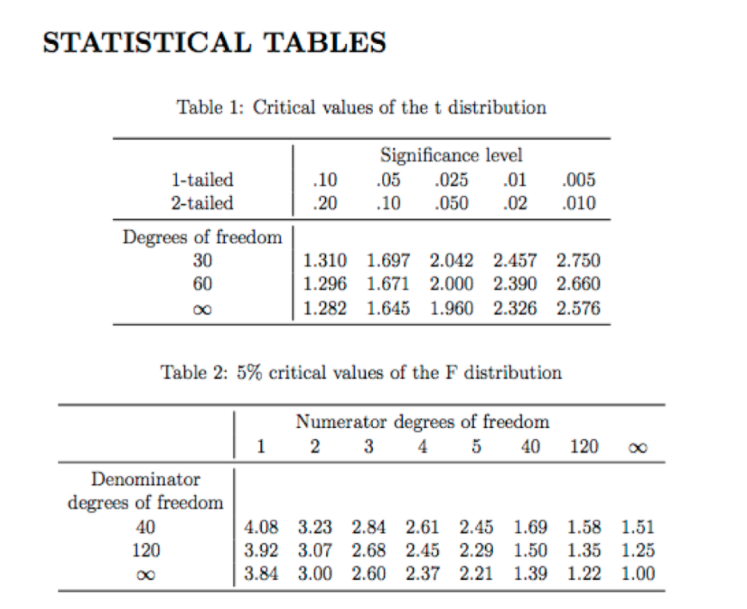
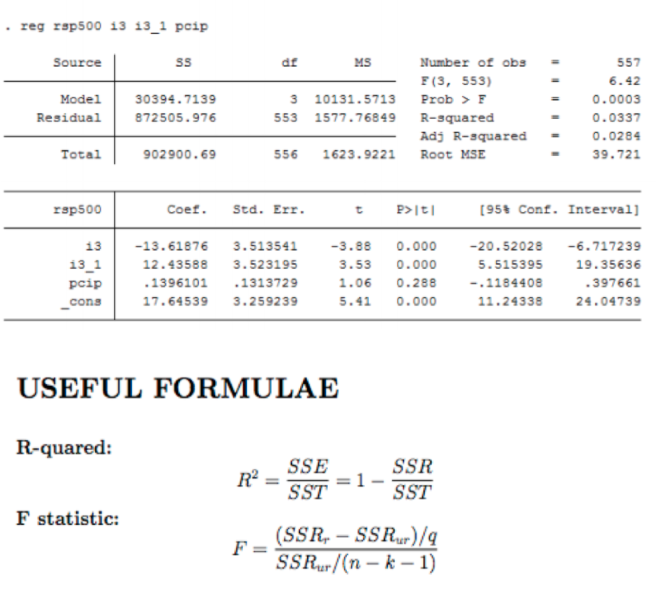
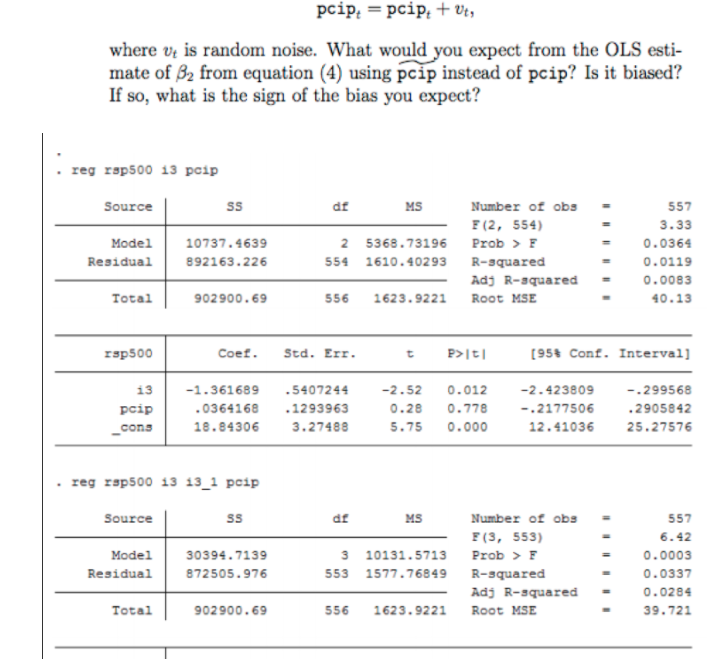
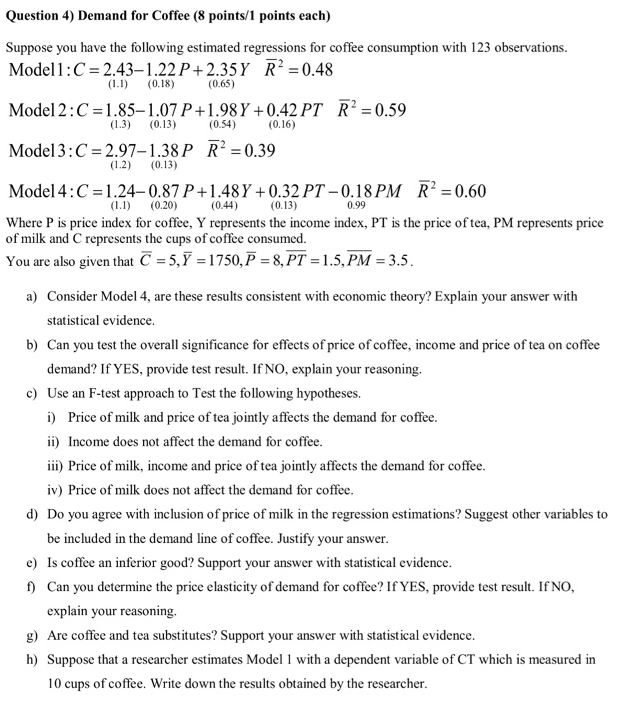
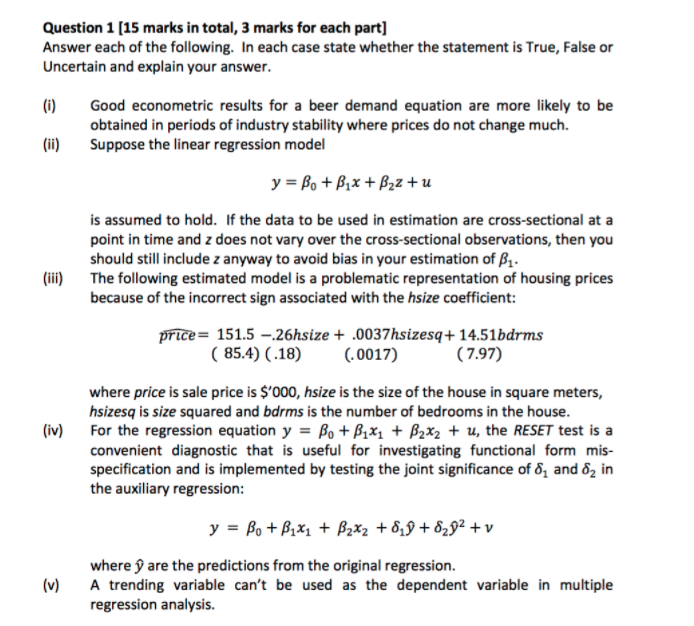
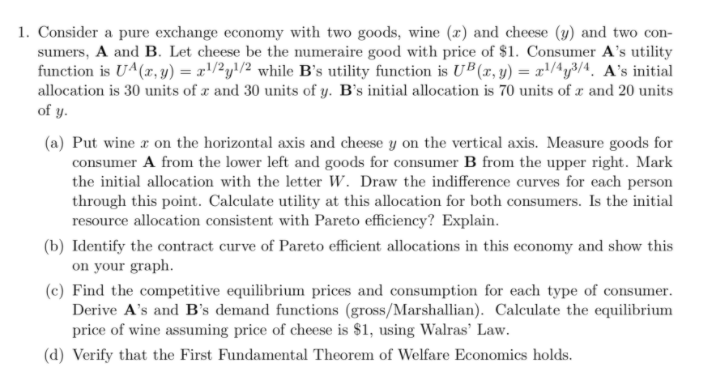
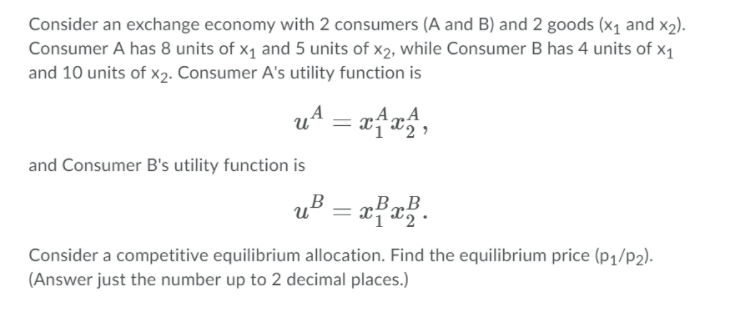
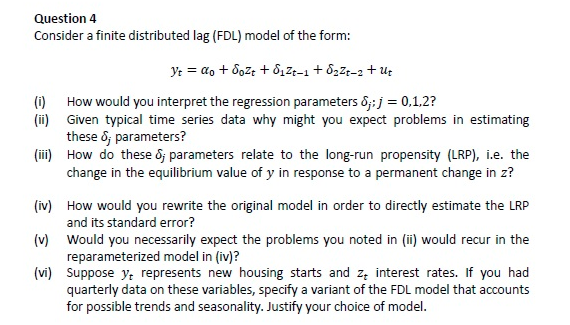
Consider the following models describing the relationship between monthly return on the Standard & Poor's 500 stock market index (rsp500), the re- turn on three-month T-bills (13) and the percentage change in industrial production (pcip): rsp500, = Bo+ 81i3, + Bopcip, + ut, (4) rsp500, = Bo + B1i3, + 8213t-1 + Bapcip, + ut. (5) 1. Is model (4) nested in the second model? If so, why? Which one appears to fit the data better? 2. Below are reported Stata outputs for OLS estimates of both models. Compare the estimated long-run propensity (LRP) for the effect of 13 derived from both models. Are they greatly different? 3. How would you rewrite the model (5) to directly estimate the LRP and its standard error? 4. Suppose the available information on pcip is a noisy measure of the true quantity, such that we only observe pcip, = pcip, + Ut,STATISTICAL TABLES Table 1: Critical values of the t distribution Significance level 1-tailed .10 .05 .025 .01 .005 2-tailed .20 .10 .050 .02 .010 Degrees of freedom 30 1.310 1.697 2.042 2.457 2.750 60 1.296 1.671 2.000 2.390 2.660 1.282 1.645 1.960 2.326 2.576 Table 2: 5% critical values of the F distribution Numerator degrees of freedom 2 3 4 5 40 120 Denominator degrees of freedom 40 4.08 3.23 2.84 2.61 2.45 1.69 1.58 1.51 120 3.92 3.07 2.68 2.45 2.29 1.50 1.35 1.25 3.84 3.00 2.60 2.37 2.21 1.39 1.22 1.00Question 4) Demand for Coffee (8 points/1 points each) Suppose you have the following estimated regressions for coffee consumption with 123 observations. Model1: C =2.43-1.22 P+ 2.35Y R= =0.48 (1.1) (0.18) (0.65) Model 2 : C =1.85-1.07 P+1.98Y +0.42 PT R= =0.59 (1.3) (0.13) (0.54) (0.16) Model 3:C =2.97-1.38P R= =0.39 (1.2) (0.13) Model 4:C =1.24-0.87 +1.48Y +0.32PT-0.18PM R' =0.60 (1.1) (0.20) (0.44) (0.13) 0.99 Where P is price index for coffee, Y represents the income index, PT is the price of tea, PM represents price of milk and C represents the cups of coffee consumed You are also given that C = 5, Y =1750, P = 8, PT =1.5, PM = 3.5. a) Consider Model 4, are these results consistent with economic theory? Explain your answer with statistical evidence. b) Can you test the overall significance for effects of price of coffee, income and price of tea on coffee demand? If YES, provide test result. If NO, explain your reasoning. c) Use an F-test approach to Test the following hypotheses. i) Price of milk and price of tea jointly affects the demand for coffee. ii) Income does not affect the demand for coffee. iii) Price of milk, income and price of tea jointly affects the demand for coffee. iv) Price of milk does not affect the demand for coffee. d) Do you agree with inclusion of price of milk in the regression estimations? Suggest other variables to be included in the demand line of coffee. Justify your answer. e) Is coffee an inferior good? Support your answer with statistical evidence. () Can you determine the price elasticity of demand for coffee? If YES, provide test result. If NO, explain your reasoning. g) Are coffee and tea substitutes? Support your answer with statistical evidence. h) Suppose that a researcher estimates Model I with a dependent variable of CT which is measured in 10 cups of coffee. Write down the results obtained by the researcher.Question 1 [15 marks in total, 3 marks for each part] Answer each of the following. In each case state whether the statement is True, False or Uncertain and explain your answer. (i) Good econometric results for a beer demand equation are more likely to be obtained in periods of industry stability where prices do not change much. (ii) Suppose the linear regression model y = Bo + Bix + Bzz + u is assumed to hold. If the data to be used in estimation are cross-sectional at a point in time and z does not vary over the cross-sectional observations, then you should still include z anyway to avoid bias in your estimation of B1. (iii) The following estimated model is a problematic representation of housing prices because of the incorrect sign associated with the hsize coefficient: price= 151.5 -.26hsize + .0037hsizesq+ 14.51bdrms ( 85.4) (.18) (. 0017) (7.97) where price is sale price is $'000, hsize is the size of the house in square meters, hsizesq is size squared and bdrms is the number of bedrooms in the house. (iv) For the regression equation y = Bo + Bi*1 + 82*2 + u, the RESET test is a convenient diagnostic that is useful for investigating functional form mis- specification and is implemented by testing the joint significance of 6, and 62 in the auxiliary regression: y = Bot B1*1 + B2x2 + 619+ 6252+v where p are the predictions from the original regression. (v) A trending variable can't be used as the dependent variable in multiple regression analysis.1. Consider a pure exchange economy.r with two goods. 1urine {I} and cheese (1;) and two con- sunierst A. and B. Let chemo he the numeraire good with price of 51. Consumer A's utilit:,r function is U'Aht', y} = I'yl while B's utility function is Winn} = Ilf'l'yaf'l'. as initial allocation is 31!] units of a: and 31.] units of y. B's initial allocation is it'll units of e and 20 units of y. {a} Put wine a: on the horizontal axis and cheese 1; on the vertical axis. Measure goods for consumer A from the lower left and goods for consumer B from the upper right. Marl: the initial allocation 1with the letter W. Draw the indifference curves for each person through this point. Calculate utility at this allocation for both consumers. Is the initial resource allocation consistent with Pareto efficiency? Explain. {h} Identify the contract curve of Pareto efcient allocations in this econo'lrljr and show this on your graph. {cl Find the competitive equilibrium prices and consumption for each type of consumer. Derive A's and B's demand functions (grossfhiarshallian). Calculate the equilibrium price of wine assuming price of cheese is 51, using 1illi'stlras" Law. {d} Verify that the First Fundamental Theorem of WEHEIE Economics holds, Consider an exchange economyr with 2 consumers [A and B} and 2 goods [x1 and :2}. Consumer A has 3 units of 1:1 and 5 units of 112, while Consumer B has 4 units of :01 and 10 units of 3:2. Consumer A's utility function is A_ A A u a:132, and Consumer B's utilityr function is B_ B B \"H $1$2. Consider a competitive equilibrium allocation. Find the equilibrium price {Ming}. {Answer iust the number up to 2 decimal places.) Question :1 Consider a nite distributed lag [FDL] model of the form: 1': = l31o + 503: + 513t1 + gazea. + \"it [i] How would you interpret the regression parameters Eff.)- = 0,1,2? [ii] Given typical b'me series data why might you expect problems in estimating thate Ej- parameters? {iii} How do these :5} parameters relate to the longmo propensity [LRPL i.e. the change in the equilibrium value of y in response to a permanent change in 3? [iv] How would you rewrite the original model in order to direcy esb'mate the LRP and ii: standard error? [y] Would you necessarily expect the problems you noted in [ii] 1would recur in the reparameterized model in [iv]? [vi] Suppose yr represents new housing starts and 1rr interest rates. If you had quartedy data on these variables, specify a variant of the FDL model that amounts for possible trends and seasonality. Jusb'ly your choice of model.
Step by Step Solution
There are 3 Steps involved in it

Get step-by-step solutions from verified subject matter experts