

Question: Hi i am working on a matlab assignment and i am dumbfounded on how to start this problem on matlab. help? Find the equation that
Hi i am working on a matlab assignment and i am dumbfounded on how to start this problem on matlab. help?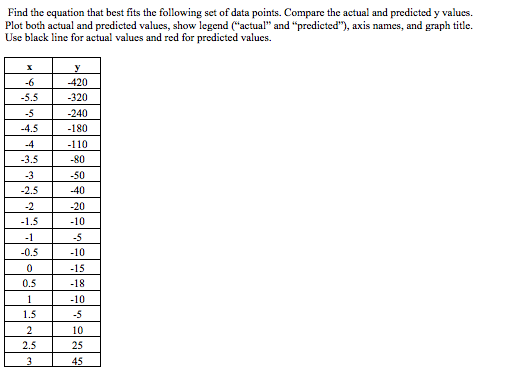
Find the equation that best fits the following set of data points. Compare the actual and predicted y values Plot both actual and predicted values, show legend actual" and "predicted), axis names, and graph title. Use black line for actual values and red for predicted values. -6 5.5 420 320 240 180 110 -80 50 -40 20 10 4.5 -4 3.5 2.5 0.5 10 0.5 1.5 2.5 25
Step by Step Solution
There are 3 Steps involved in it
1 Expert Approved Answer
Step: 1 Unlock

Question Has Been Solved by an Expert!
Get step-by-step solutions from verified subject matter experts
Step: 2 Unlock
Step: 3 Unlock