

Question: Hi, I am working on a python question which involves Pandas. The question is below, The dataset can be found in the location below, wine_file=https://raw.githubusercontent.com/ksynnott/VM-DS-Data/master/winequality.csv
Hi,
I am working on a python question which involves Pandas. The question is below,
The dataset can be found in the location below,
wine_file="https://raw.githubusercontent.com/ksynnott/VM-DS-Data/master/winequality.csv"
the relevant code is also below,
df=pd.read_csv(wine_file,sep=';')
df.columns=df.columns.str.replace('','_')
Let me know if you require any additional information and I will happily be of help!
Thanks,
Adam
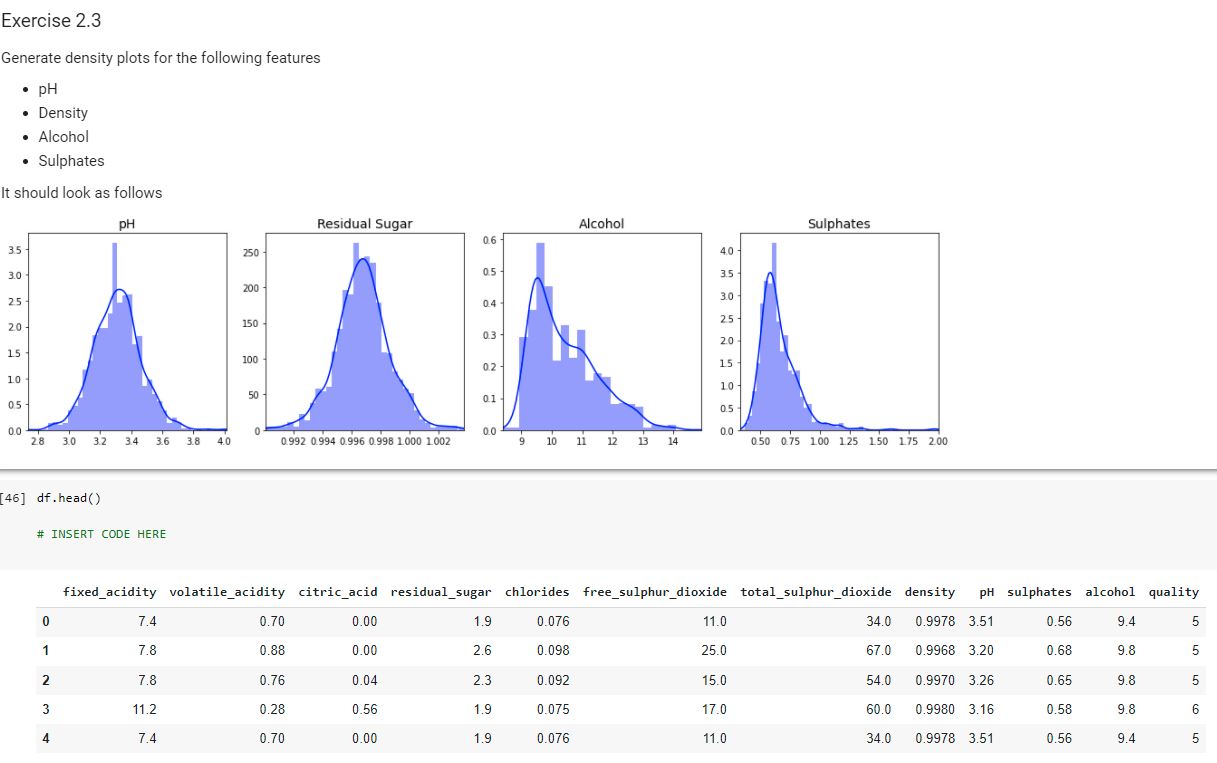
Exercise 2.3 Generate density plots for the following features PH Density Alcohol . Sulphates It should look as follows PH Residual Sugar Alcohol Sulphates 35 0.6 250 40 3.0 05 3.5 200 25 04 3.0 20 150 25 03 20 15 100 02 15 10 10 05 01 05 00 00 28 3.0 3.2 34 3.6 3.8 0.0 4.0 0.992 0.994 0.996 0.998 1000 1002 9 10 11 12 13 14 050 075 100 125 150 175 200 [46] df . head( ) # INSERT CODE HERE fixed_acidity volatile_acidity citric_acid residual_sugar chlorides free_sulphur_dioxide total_sulphur_dioxide density PH sulphates alcohol quality 7.4 0.70 0.00 1.9 0.076 11.0 34.0 0.9978 3.51 0.56 9.4 5 7.8 0.88 0.00 2.6 0.098 25.0 67.0 0.9968 3.20 0.68 9.8 N 7.8 0.76 0.04 2.3 0.092 15.0 54.0 0.9970 3.26 0.65 9.8 5 11.2 0.28 0.56 1.9 0.075 17.0 60.0 0.9980 3.16 0.58 9.8 6 7.4 0.70 0.00 1.9 0.076 11.0 34.0 0.9978 3.51 0.56 9.4 5
Step by Step Solution
There are 3 Steps involved in it

Get step-by-step solutions from verified subject matter experts