

Question: Hi , I found this code on Chegg from the expert, and I never used the polar function, so could you please provide the comments
Hi I found this code on Chegg from the expert, and I never used the polar function, so could you please provide the "comments" on the code line below so I can understand it Thank you!
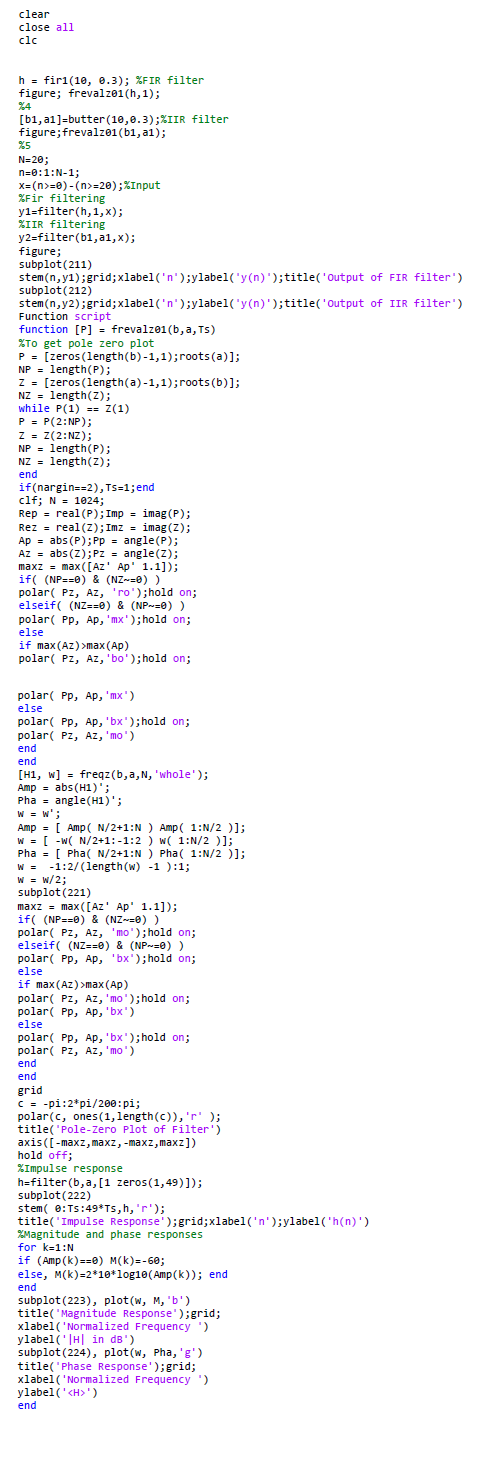
clear
close all
clc
h fir; FIR filter
figure; frevalzh;
b abutter;IIR filter
figure; frevalzba;
N;
n::N;
Fir filtering
yfilterhx;
IIR filtering
yfilterbax;
figure;
subplot
stemny;grid;xlabeln;ylabelyn;titleOutput of FIR filter'
subplot
stemny;grid;xlabeln;ylabelyn;titleOutput of IIR filter'
Function script
function P frevalzbaTs
To get pole zero plot
P zeroslengthb;rootsa;
NP lengthP;
z zeroslengtha;rootsb;
NZ lengthz;
while P Z
P P:NP;
Z Z:NZ;
NP lengthP;
NZ lengthZ;
end
ifnarginTs;end
clf; N ;
Rep realP;Imp imagP;
Rez realZ;Imz imagZ;
Ap absP;Pp angleP;
Az absZ;PZ angleZ;
maxz maxAZ Ap;
ifNP & NZ
polar Pz Azro;hold on;
elseifNZ & NP~
polar Pp Apmx;hold on;
else
if maxAZmaxAp
polar PZ AZbo;hold on;
polar Pp Apmx
polar Pp Apbx;hold on;
polar Pz Azmo
end
end
H w freqzbaN'whole';
Amp absH;
Pha angleH;
w w;
Amp AmpN:N Amp:N;
w w N:: w:N;
Pha Pha N:N Pha:N;
w :lengthw:;
w w;
subplot
maxz maxAz Ap;
ifNP & NZ
polar PZ Azmo;hold on;
elseifNZ & NP~
polar Pp Apbx;hold on;
else
if maxAzmaxAp
polar PZ Azmo;hold on;
polar Pp Apbx
else
polar Pp Apbx;hold on;
polar PZ Azmo
end
end
grid
c pi:pi:pi;
polarc oneslengthcr;
titlePoleZero Plot of Filter'
axismaxz,maxz, maxz, maxz
hold off;
Impulse response
hfilterba zeros;
subplot
stem:Ts:Tshr;
titleImpulse Response';grid;xlabeln;ylabelhn
Magnitude and phase responses
for k:N
if Ampk Mk;
else, Mk logAmpk; end
end
subplot plotw Mb
titleMagnitude Response';grid;
xlabelNormalized Frequency
ylabelH in dB
subplot plotw Pha,g
titlePhase Response';grid;
xlabelNormalized Frequency
ylabel
end
Step by Step Solution
There are 3 Steps involved in it
1 Expert Approved Answer
Step: 1 Unlock

Question Has Been Solved by an Expert!
Get step-by-step solutions from verified subject matter experts
Step: 2 Unlock
Step: 3 Unlock