

Question: Hi, I have attached some study material below, would you be able to show me the correct way for these questions to use as a
Hi, I have attached some study material below, would you be able to show me the correct way for these questions to use as a guideline in the future?
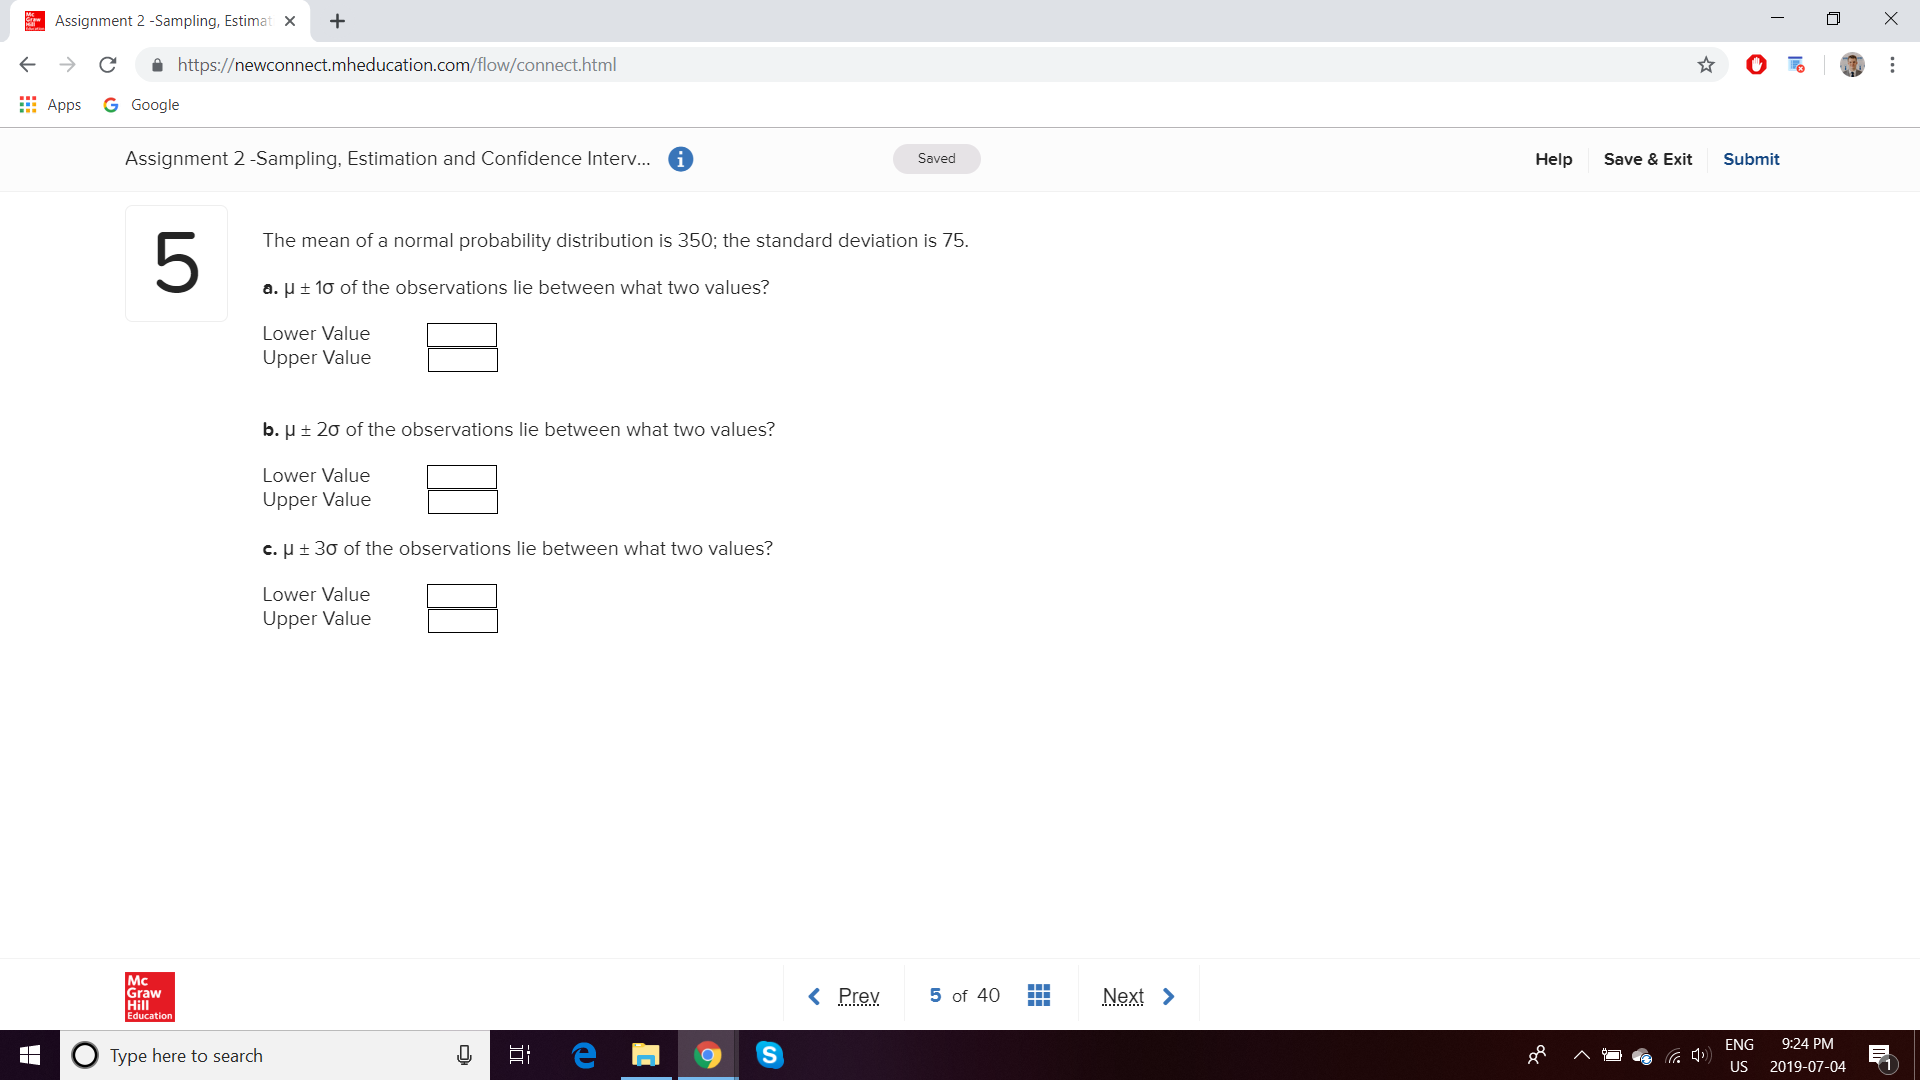
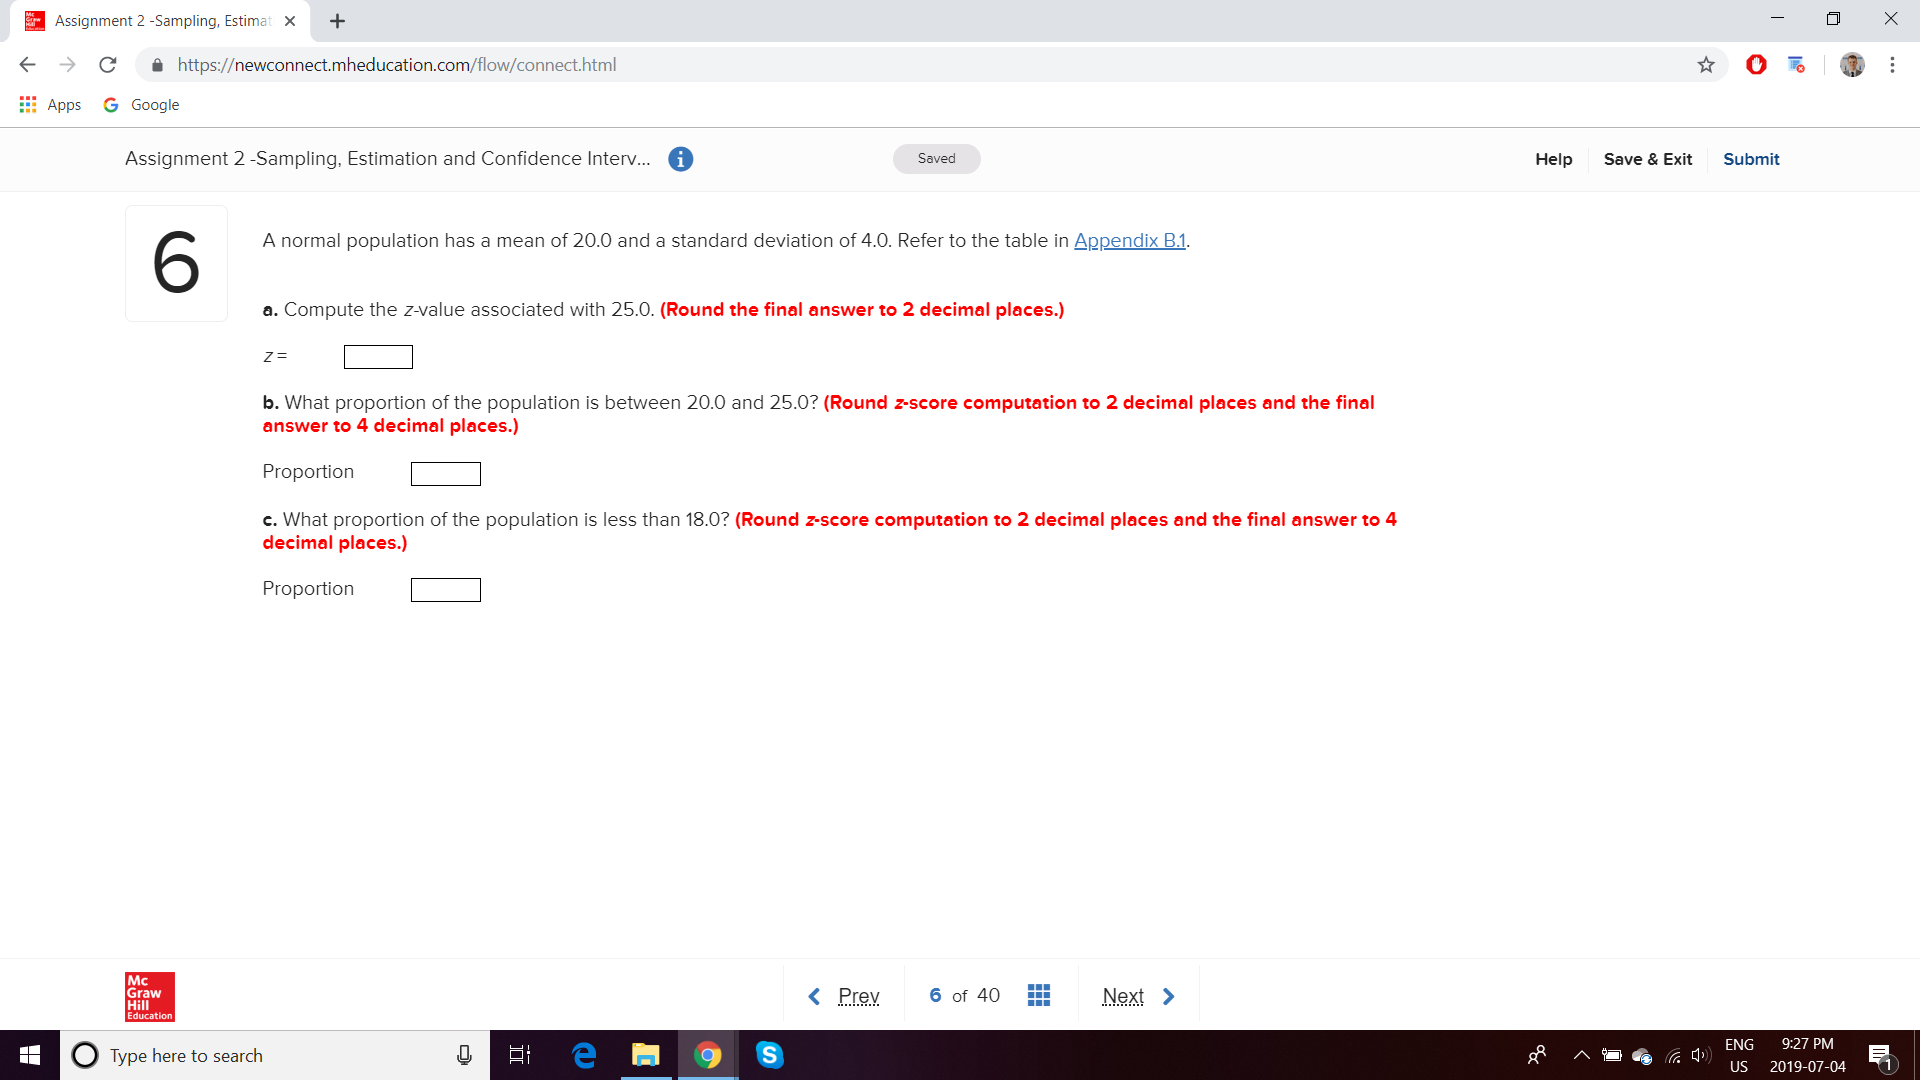
Assignment 2 Sampling Estime x + 7 X (- 9 C O https:lewconneclmheducation.com/ow/conne(t.htrnl 0 E . App; 0 Google Assignment 2 Sampling, Estimation and Confidence lnterv... 0 Saved Help Save 3. Exit Submit 5 The mean ofa normal probability distribution is 350; the standard deviation is 75. a. u i 10 of the observations lie between what two values? Lower Value Upper Value bl |.| : 20 of the observations lie between what two values? Lower Value Upper Value c. u t 30 of the observations lie between what two values? Lower Value Upper Value ( Prev 5 of 40 Next ) Assignment 2 -Sampling, Estimat + X -> C A https:/ewconnect.mheducation.com/flow/connect.html O To : Apps G Google Assignment 2-Sampling, Estimation and Confidence Interv... Saved Help Save & Exit Submit 6 A normal population has a mean of 20.0 and a standard deviation of 4.0. Refer to the table in Appendix B.1. a. Compute the z-value associated with 25.0. (Round the final answer to 2 decimal places.) Z = b. What proportion of the population is between 20.0 and 25.0? (Round z-score computation to 2 decimal places and the final answer to 4 decimal places.) Proportion c. What proportion of the population is less than 18.0? (Round z-score computation to 2 decimal places and the final answer to 4 decimal places.) Proportion Mc Graw Hill O Type here to search emo S ENG 9:27 PM US 2019-07-04 E
Step by Step Solution
There are 3 Steps involved in it

Get step-by-step solutions from verified subject matter experts