

Question: Hi, I have read this from a report from RBA Secondary Market Liquidity in Bonds and Asset-backed Securities, and I cannot understand what the
Hi, I have read this from a report from RBA "Secondary Market Liquidity in Bonds and Asset-backed Securities", and I cannot understand what the means of the "Bonds with higher outstanding values", and what the " these bonds will be traded more often in all markets" means in the end of first paragraph, is that conclusion will have an influence for the market? Could you explain it in detail? Many thanks.
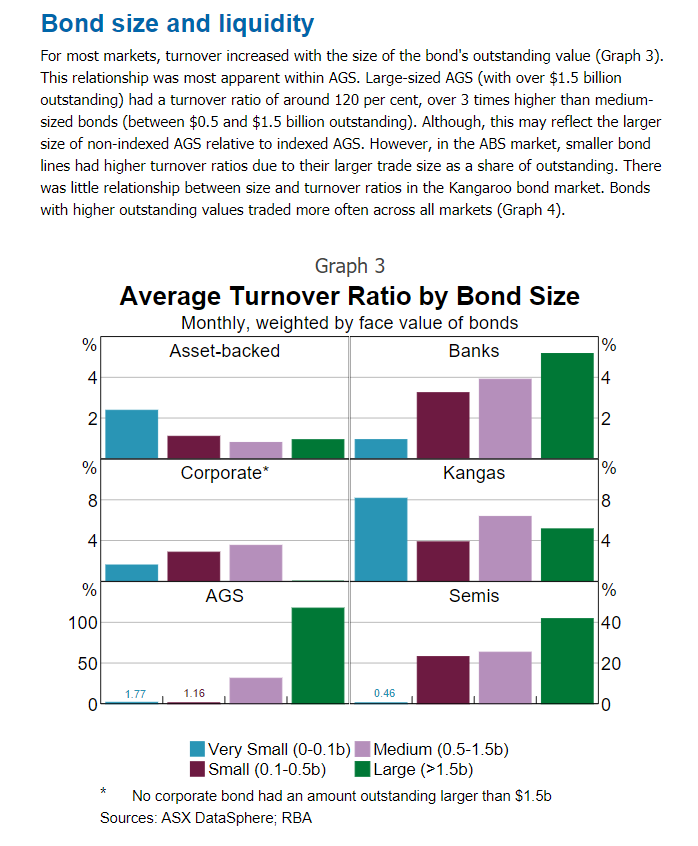
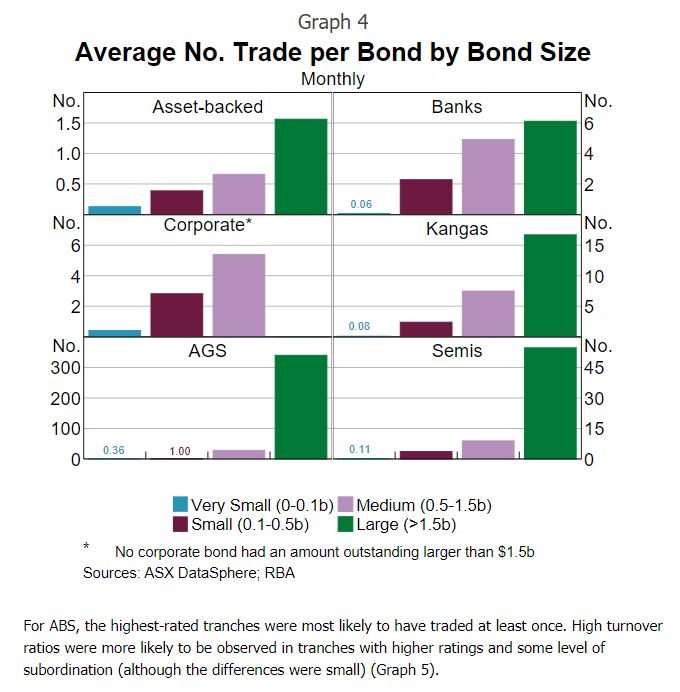
Bond size and liquidity For most markets, turnover increased with the size of the bond's outstanding value (Graph 3). This relationship was most apparent within AGS. Large-sized AGS (with over $1.5 billion outstanding) had a turnover ratio of around 120 per cent, over 3 times higher than medium- sized bonds (between $0.5 and $1.5 billion outstanding). Although, this may reflect the larger size of non-indexed AGS relative to indexed AGS. However, in the ABS market, smaller bond lines had higher turnover ratios due to their larger trade size as a share of outstanding. There was little relationship between size and turnover ratios in the Kangaroo bond market. Bonds with higher outstanding values traded more often across all markets (Graph 4). Graph 3 Average Turnover Ratio by Bond Size Monthly, weighted by face value of bonds Asset-backed Banks % 1% 4 4 2 2 2 % Corporate* Kangas % 00 8 4 % AGS Semis % 100 40 50 20 1.77 1.16 0.46 0 0 Very Small (0-0. 1b) Medium (0.5-1.5b) Small (0.1-0.5b) Large (>1.5b) No corporate bond had an amount outstanding larger than $1.5b Sources: ASX DataSphere; RBA * Graph 4 Average No. Trade per Bond by Bond Size Monthly No. Asset-backed Banks No. 1.5 6 1.0 4 0.5 2 0.06 No. 6 Corporate* Kangas No. 15 4 4 10 5 N 0.08 No. 300 AGS Semis No. 45 200 30 100 15 0.36 1.00 0.11 0 0 Very Small (0-0.1b) Medium (0.5-1.5b) Small (0.1-0.5b) Large (>1.5b) No corporate bond had an amount outstanding larger than $1.5b Sources: ASX DataSphere; RBA * For ABS, the highest-rated tranches were most likely to have traded at least once. High turnover ratios were more likely to be observed in tranches with higher ratings and some level of subordination (although the differences were small) (Graph 5). Bond size and liquidity For most markets, turnover increased with the size of the bond's outstanding value (Graph 3). This relationship was most apparent within AGS. Large-sized AGS (with over $1.5 billion outstanding) had a turnover ratio of around 120 per cent, over 3 times higher than medium- sized bonds (between $0.5 and $1.5 billion outstanding). Although, this may reflect the larger size of non-indexed AGS relative to indexed AGS. However, in the ABS market, smaller bond lines had higher turnover ratios due to their larger trade size as a share of outstanding. There was little relationship between size and turnover ratios in the Kangaroo bond market. Bonds with higher outstanding values traded more often across all markets (Graph 4). Graph 3 Average Turnover Ratio by Bond Size Monthly, weighted by face value of bonds Asset-backed Banks % 1% 4 4 2 2 2 % Corporate* Kangas % 00 8 4 % AGS Semis % 100 40 50 20 1.77 1.16 0.46 0 0 Very Small (0-0. 1b) Medium (0.5-1.5b) Small (0.1-0.5b) Large (>1.5b) No corporate bond had an amount outstanding larger than $1.5b Sources: ASX DataSphere; RBA * Graph 4 Average No. Trade per Bond by Bond Size Monthly No. Asset-backed Banks No. 1.5 6 1.0 4 0.5 2 0.06 No. 6 Corporate* Kangas No. 15 4 4 10 5 N 0.08 No. 300 AGS Semis No. 45 200 30 100 15 0.36 1.00 0.11 0 0 Very Small (0-0.1b) Medium (0.5-1.5b) Small (0.1-0.5b) Large (>1.5b) No corporate bond had an amount outstanding larger than $1.5b Sources: ASX DataSphere; RBA * For ABS, the highest-rated tranches were most likely to have traded at least once. High turnover ratios were more likely to be observed in tranches with higher ratings and some level of subordination (although the differences were small) (Graph 5)
Step by Step Solution
There are 3 Steps involved in it

Get step-by-step solutions from verified subject matter experts