

Question: Hi! I have to include a graph in a paper that shows real GDP growth rates for each year I chose 1980 decade. I went
Hi! I have to include a graph in a paper that shows real GDP growth rates for each year I chose 1980 decade. I went on to Fred and believe I have correct graph info. Can someone confirm?
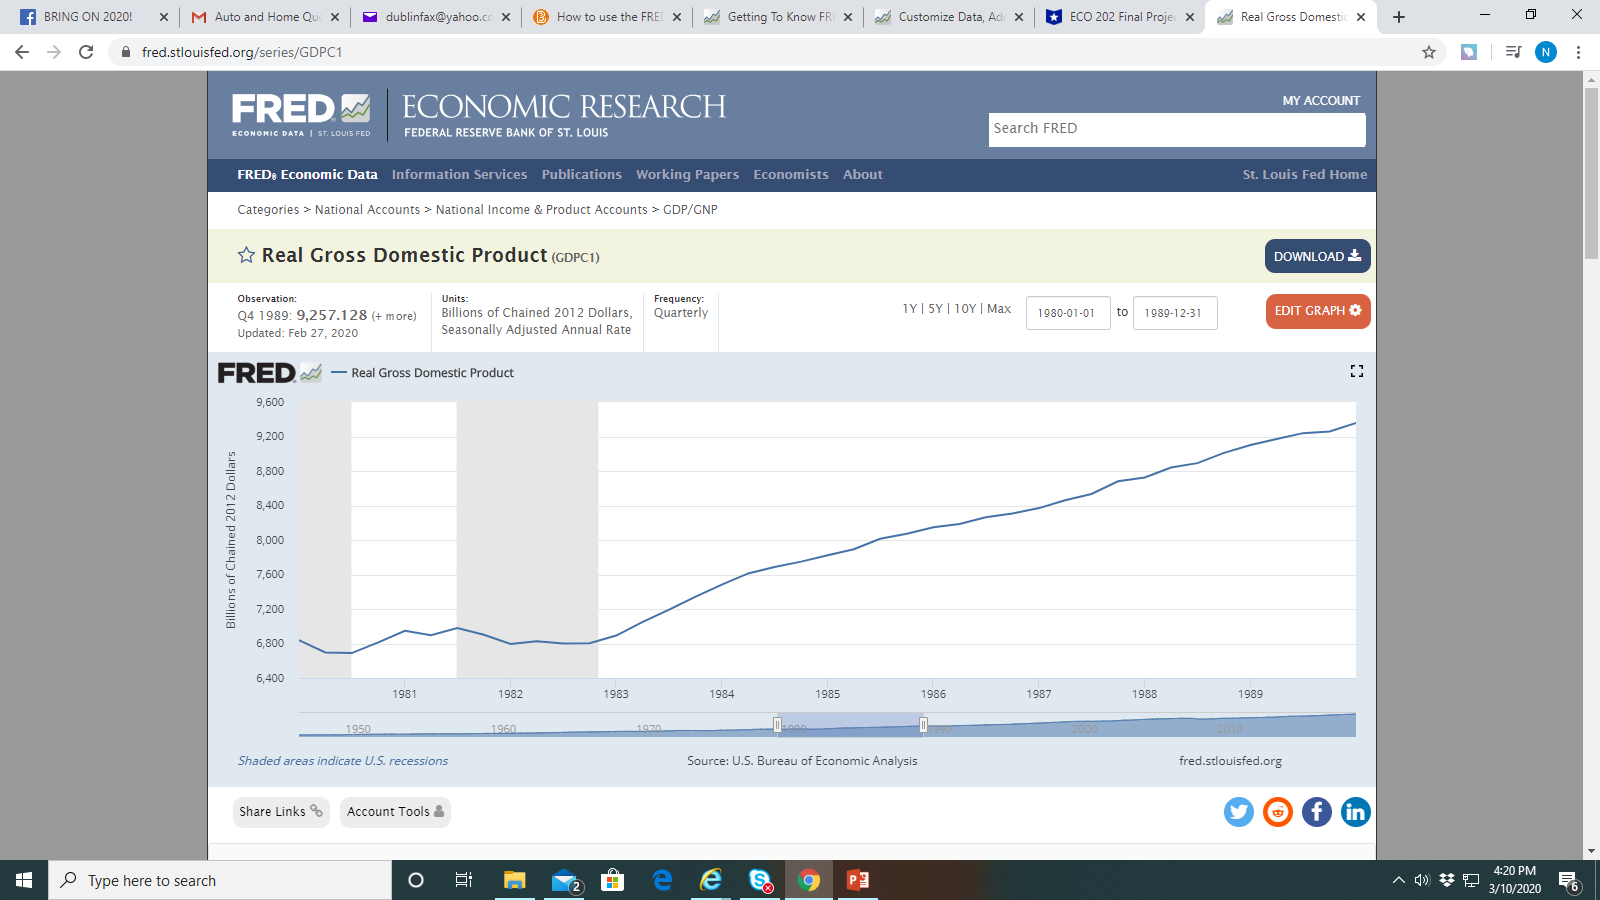
f BRING ON 2020! * M Auto and Home Quc X dublinfax@yahoo.cc x B How to use the FREI X Getting To Know FRI X Customize Data, Ad X ECO 202 Final Project X Real Gross Domestic X + X - > C A fred.stlouisfed.org/series/GDPC1 N ... FRED ~ ECONOMIC RESEARCH MY ACCOUNT ECONOMIC DATA | ST. LOUIS FED FEDERAL RESERVE BANK OF ST. LOUIS Search FRED FRED: Economic Data Information Services Publications Working Papers Economists About St. Louis Fed Home Categories > National Accounts > National Income & Product Accounts > GDP/GNP Real Gross Domestic Product (GDPCI) DOWNLOAD Observation: Units: Frequency: Q4 1989: 9,257.128 (+ more) Billions of Chained 2012 Dollars, Quarterly 1Y | 5Y | 10Y | Max 1980-01-01 to 1989-12-31 EDIT GRAPH Updated: Feb 27, 2020 Seasonally Adjusted Annual Rate FRED ~- Real Gross Domestic Product 9,600 9,20 Billions of Chained 2012 Dollars 8,80 8,400 8,000 7,600 7.200 6,800 5,400 1981 1982 1983 1984 1985 1986 1987 1988 1989 1950 1960 1970 Shaded areas indicate U.S. recessions Source: U.S. Bureau of Economic Analysis fred.stlouisfed.org Share Links % Account Tools & )f in Type here to search O Fi Bee 9 4:20 PM ( 3/10/2020 E
Step by Step Solution
There are 3 Steps involved in it

Get step-by-step solutions from verified subject matter experts