

Question: Hi! I need a density graph for these problems. Please share where they need to be shaded and have all info like numbers etc. 35.
Hi! I need a density graph for these problems. Please share where they need to be shaded and have all info like numbers etc.
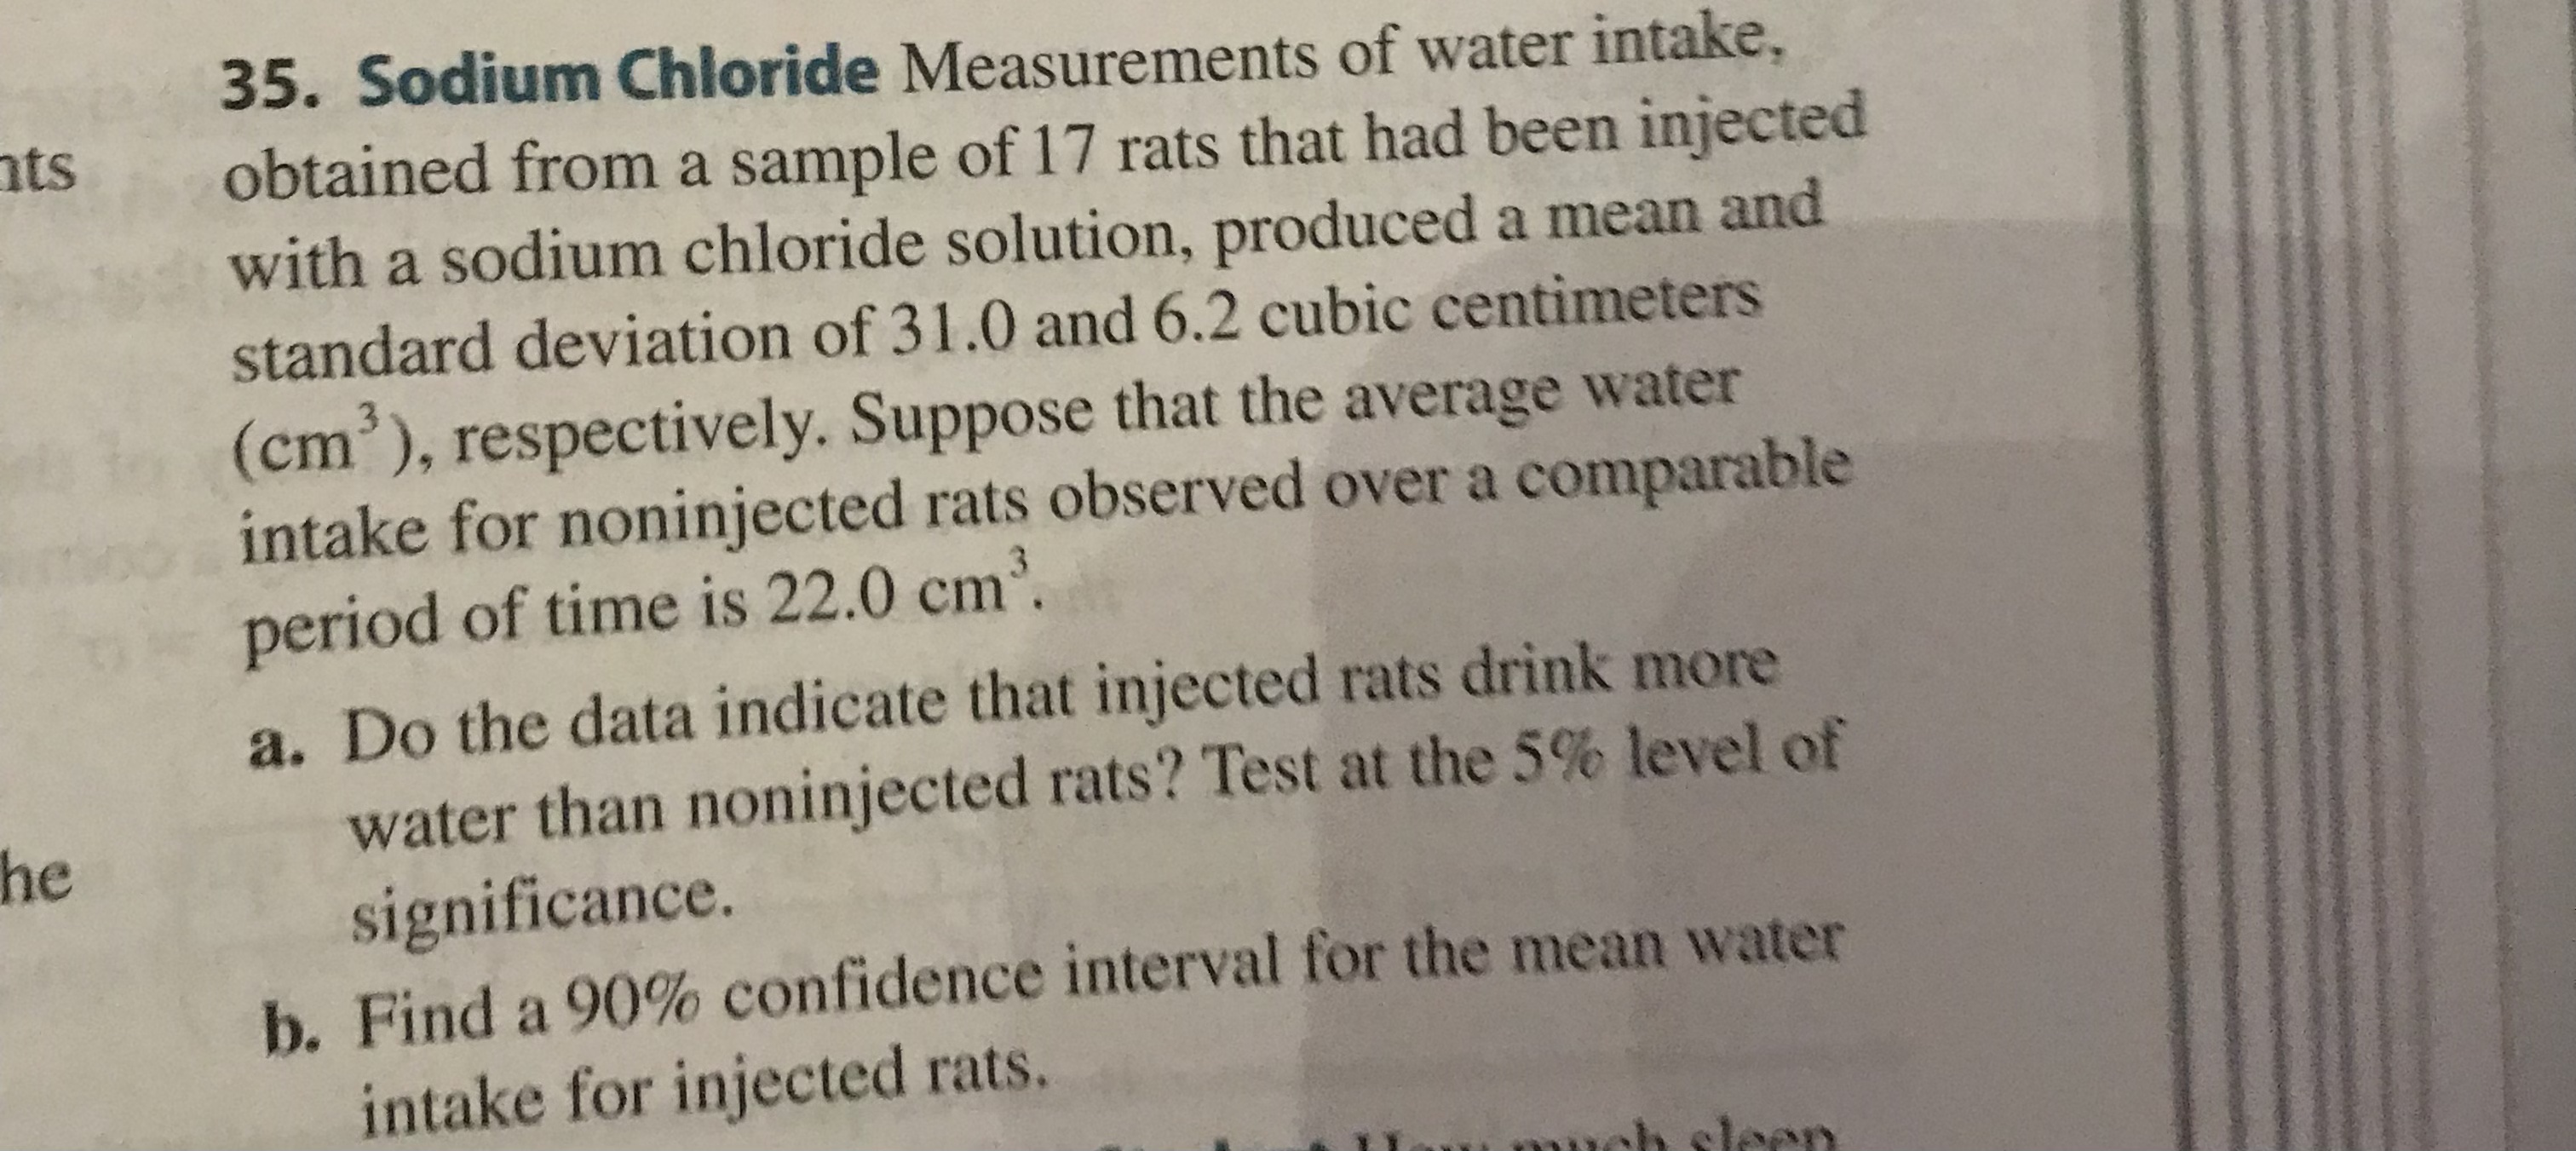
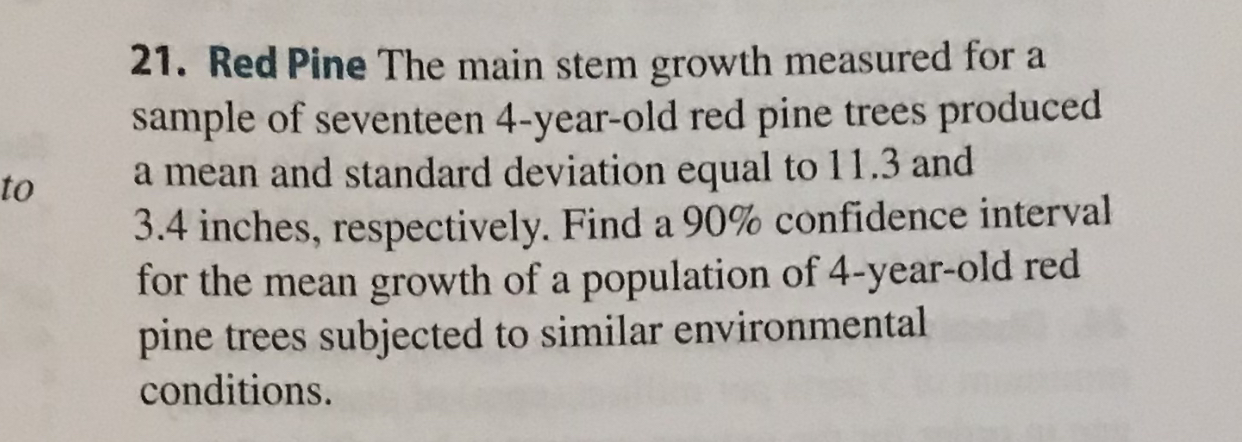
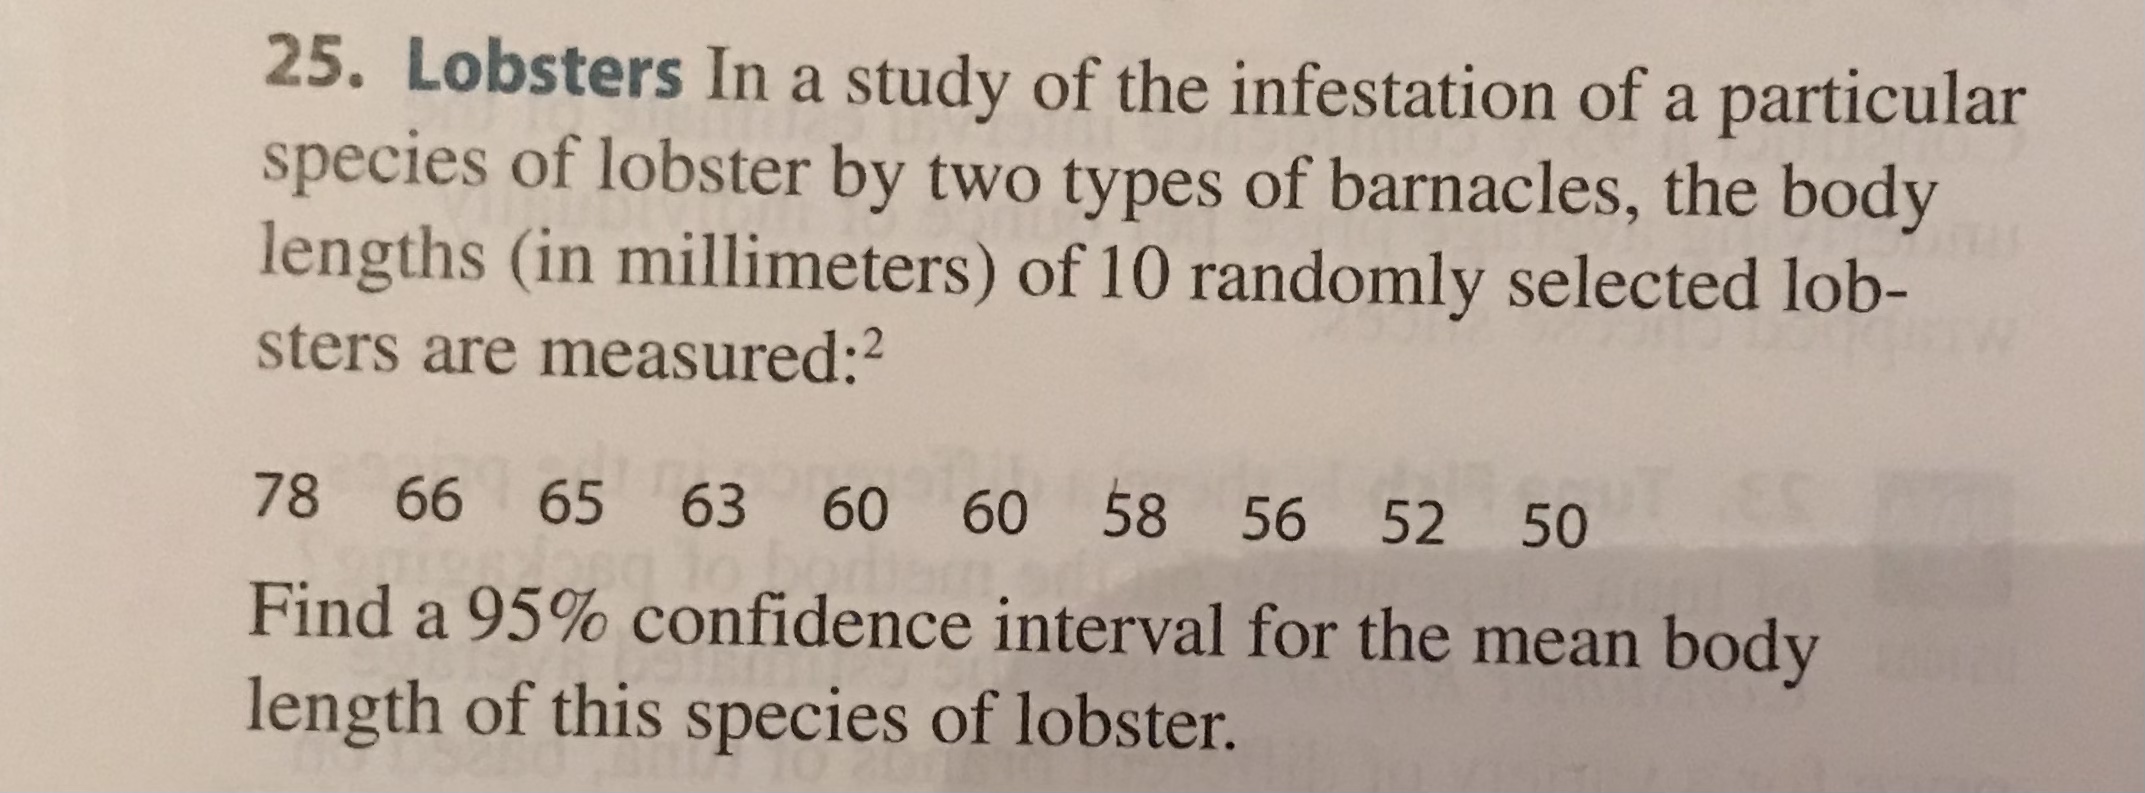
35. Sodium Chloride Measurements of water intake, its obtained from a sample of 17 rats that had been injected with a sodium chloride solution, produced a mean and standard deviation of 31.0 and 6.2 cubic centimeters (cm'), respectively. Suppose that the average water intake for noninjected rats observed over a comparable period of time is 22.0 cm'. a. Do the data indicate that injected rats drink more water than noninjected rats? Test at the 5% level of he significance. b. Find a 90% confidence interval for the mean water intake for injected rats.21. Red Pine The main stem growth measured for a sample of seventeen 4-year-old red pine trees produced to a mean and standard deviation equal to 11.3 and 3.4 inches, respectively. Find a 90% confidence interval for the mean growth of a population of 4-year-old red pine trees subjected to similar environmental conditions.25. Lobsters In a study of the infestation of a particular species of lobster by two types of barnacles, the body lengths (in millimeters) of 10 randomly selected lob- sters are measured:2 78 66 65 63 60 60 58 56 52 50 Find a 95% confidence interval for the mean body length of this species of lobster
Step by Step Solution
There are 3 Steps involved in it

Get step-by-step solutions from verified subject matter experts