

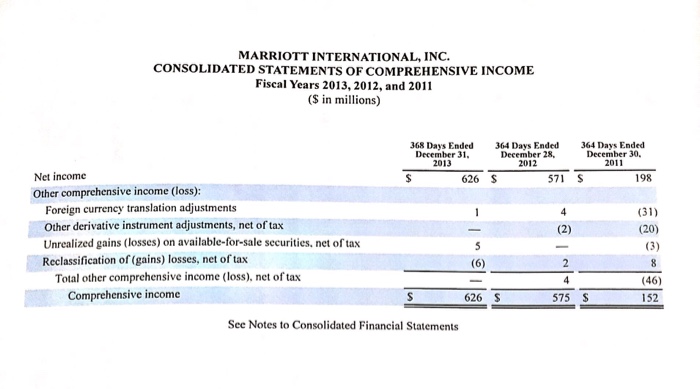
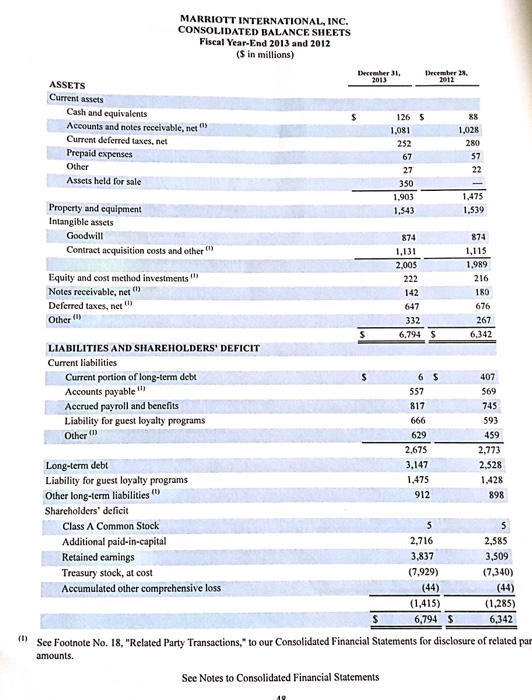
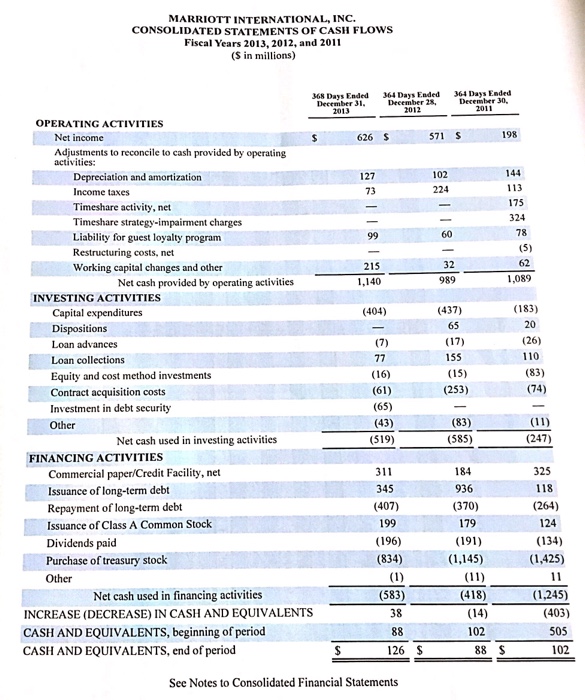
Question: Hi i need help calculating the Vertical and Horizontal Analysis for the Marriott Intercontinental with the Financial Statement of Year 2013. Please, I would appreciate
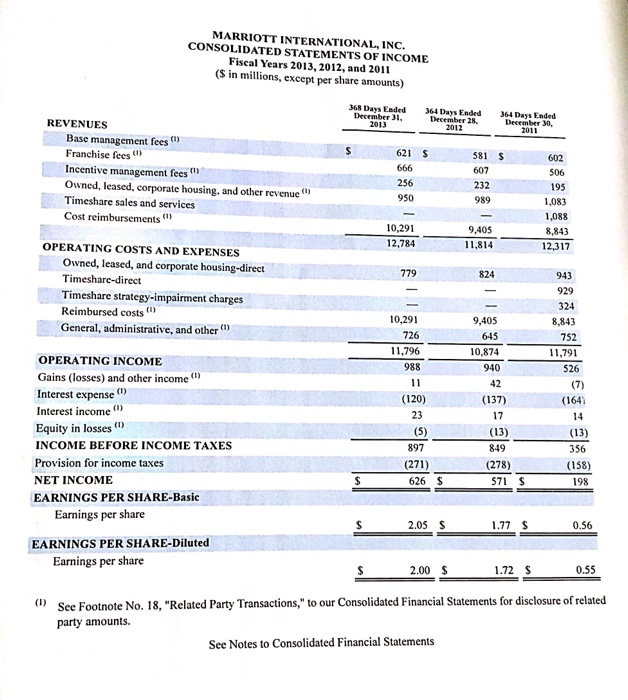
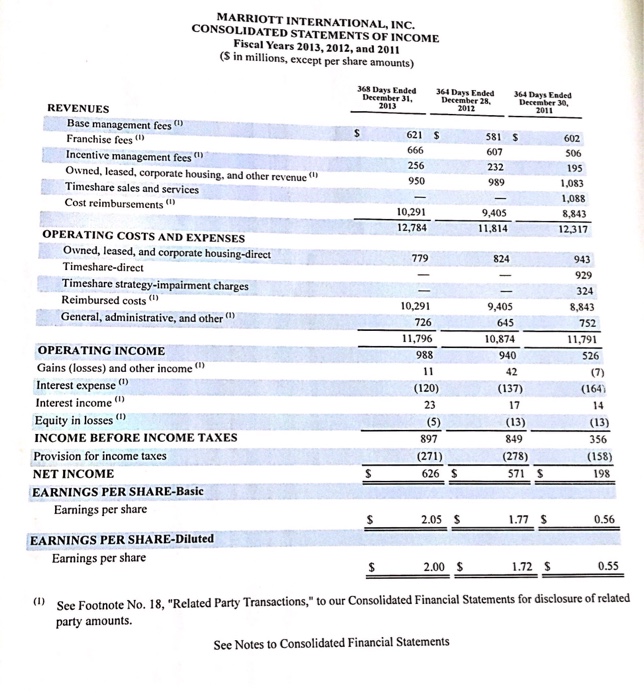
MARRIOTT INTERNATIONAL, INC. CONSOLIDATED STATEMENTS OF INCOME Fiscal Years 2013,2012, and 2011 (S in millions, except per share amounts) 368 Days Ended 364 Days Ended 364 Days Ended December 30 December 3 December 28 2012 2013 REVENUES Base management feesX Franchise fees Incentive management fees " Owned, leased, corporate housing, and other revenue Timeshare sales and services Cost reimbursements 621 S 581 S 607 232 602 506 195 1,083 1,088 8,843 12,317 256 950 10,291 12,784 9,405 11,814 OPERATING COSTS AND EXPENSES Owned, leased, and corporate housing-direct Timeshare-direct Timeshare strategy-impairment charges Reimbursed costs General, administrative, and other 779 824 943 10,291 726 11,796 988 9,405 645 0,874 940 324 8,843 752 11,791 526 OPERATING INCOME Gains (losses) and other income) Interest expense Interest income Equity in losses INCOME BEFORE INCOME TAXES Provision for income taxes NET INCOME EARNINGS PER SHARE-Basic 42 (137) (164) (120) 23 17 (13) 849 897 (271) 626 S (13) 356 (158) 198 (278) 571 S Earnings per share 2.05 S 1.77 S 0.56 EARNINGS PER SHARE-Diluted Earnings per share 2.00 $ 1.72 S 0.55 () See Footnote No. 18, "Related Party Transactions," to our Consolidated Financial Statements for disclosure of related party amounts. See Notes to Consolidated Financial Statements
Step by Step Solution
There are 3 Steps involved in it

Get step-by-step solutions from verified subject matter experts