

Question: Hi , i need help drawing the graph on excel. its the topic of buffer capacity. the course subject is instrumental analysis Part 1: Effect
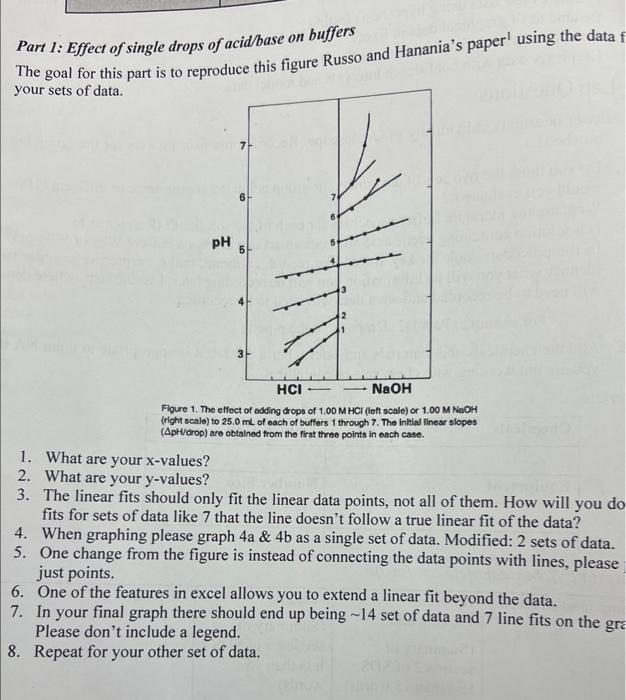
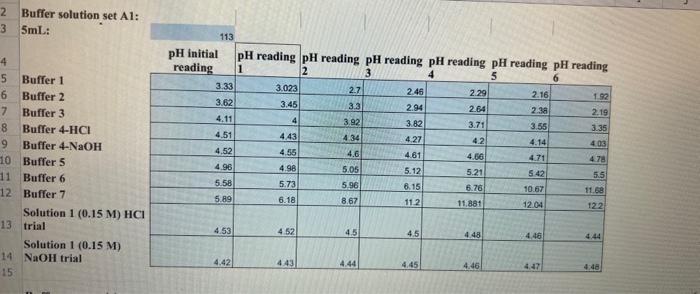
Part 1: Effect of single drops of acidbase on buffers The goal for this part is to reproduce this figure Russo and Hanania's paper 1 using the data your sets of data. Floure 1. The effect of adding drops of 1.00 M HCl (left scale) or 1.00MNaOH (right scale) to 25.0mL of each of buffers 1 throuch 7. The inltial linear slopes ( pH/ drop) are obtalned from the first three points in each case. 1. What are your x-values? 2. What are your y-values? 3. The linear fits should only fit the linear data points, not all of them. How will you do fits for sets of data like 7 that the line doesn't follow a true linear fit of the data? 4. When graphing please graph 4a&4b as a single set of data. Modified: 2 sets of data. 5. One change from the figure is instead of connecting the data points with lines, please just points. 6. One of the features in excel allows you to extend a linear fit beyond the data. 7. In your final graph there should end up being 14 set of data and 7 line fits on the gre Please don't include a legend. 8. Repeat for your other set of data. 2 Buffer solution set A1: Buffer 1 Buffer 2 Buffer 3 Buffer 4-HCl Buffer 4-NaOH Buffer 5 Buffer 6 Buffer 7 Solution 1 (0.15 M) HCl trial Solution 1 (0.15 M) NaOH trial \begin{tabular}{|r|r|r|r|r|r|r|} \hline \multicolumn{1}{|c|}{pHinitialreading} & pH reading \\ \hline \end{tabular} Part 1: Effect of single drops of acidbase on buffers The goal for this part is to reproduce this figure Russo and Hanania's paper 1 using the data your sets of data. Floure 1. The effect of adding drops of 1.00 M HCl (left scale) or 1.00MNaOH (right scale) to 25.0mL of each of buffers 1 throuch 7. The inltial linear slopes ( pH/ drop) are obtalned from the first three points in each case. 1. What are your x-values? 2. What are your y-values? 3. The linear fits should only fit the linear data points, not all of them. How will you do fits for sets of data like 7 that the line doesn't follow a true linear fit of the data? 4. When graphing please graph 4a&4b as a single set of data. Modified: 2 sets of data. 5. One change from the figure is instead of connecting the data points with lines, please just points. 6. One of the features in excel allows you to extend a linear fit beyond the data. 7. In your final graph there should end up being 14 set of data and 7 line fits on the gre Please don't include a legend. 8. Repeat for your other set of data. 2 Buffer solution set A1: Buffer 1 Buffer 2 Buffer 3 Buffer 4-HCl Buffer 4-NaOH Buffer 5 Buffer 6 Buffer 7 Solution 1 (0.15 M) HCl trial Solution 1 (0.15 M) NaOH trial \begin{tabular}{|r|r|r|r|r|r|r|} \hline \multicolumn{1}{|c|}{pHinitialreading} & pH reading \\ \hline \end{tabular}
Step by Step Solution
There are 3 Steps involved in it

Get step-by-step solutions from verified subject matter experts