

Question: HI, I need help, I have an assignment about Financial Analysis which we have just starting to learn in class! I finally got all the
HI,
I need help, I have an assignment about Financial Analysis which we have just starting to learn in class!
I finally got all the number (I think) and now I need to do the analysis but I am lost. I need to compare the ratios for all 3 years, but my teacher does not want a short or quick answer..
Instructions of my teacher...
Perform a financial analysis using at least three ratios from each category (WHICH I DID) Your analysis should include calculation of the ratios for at least three years. Then, using the calculated data, perform a trend analysis (THIS IS WHERE I NEED HELP WITH) where you interpret the results.
So, what I need is perform a trend analysis of the ratios, interpreting the results.
Again, as always, a better than, worse than, improving or deteriorating analysis is not a substantive conclusion. Explain what is happening and why!
Finally, utilizing the Altman Z-score (see Course Content), determine if your selected company is at risk for bankruptcy. Explain why or why not. (I think I did this one correctly)
Help please, thanks
Added better pictures
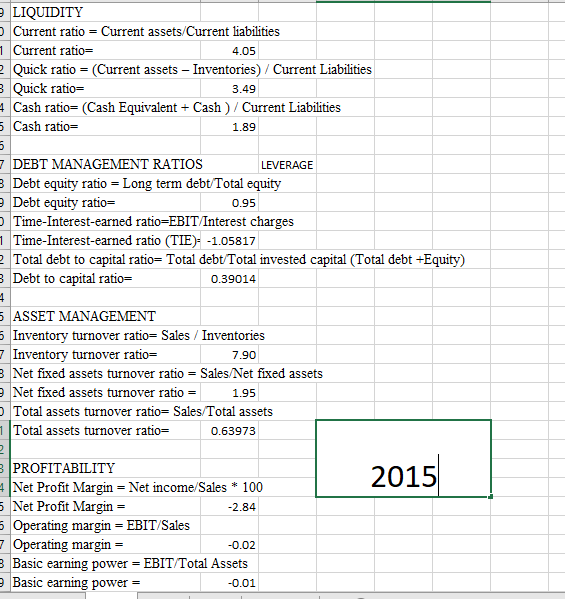
LIQUIDITY Current ratio 1 Current ratio Current assets/Current liabilities 4.05 Quick ratio (Current assets-Inventories) / Current Liabilities Quick ratio= 3.49 4 Cash ratio= (Cash Equivalent + Cash ) / Current Liabilities Cash ratio= 1.89 DEBT MANAGEMENT RATIOS Debt equity ratio = Long term debt/Total Debt equity ratio= Time-Interest-earned ratio-EBIT/Interest charges LEVERAGE 0.95 1Time-Interest-earned ratio (TIE-1.05817 2Total debt to capital ratio- Total debtTotal invested capital (Total debt +Equity) Debt to capital ratio- 0.39014 5 ASSET MANAGEMENT 6 Inventory turnover ratio-Sales / Inventories Inventory turnover ratio= 7.90 Net fixed assets turnover ratio = Sales Net fixed assets Net fixed assets turnover ratio = Total assets turnover ratio- Sales Total assets 1.95 1Total assets turnover ratio- 0.63973 PROFITABILITY | Net Profit Margin Net Profit Margin 2015 Net income Sales * 100 2.84 5 Operating margin - EBIT/Sales Operating margin- Basic earning power- EBIT/Total Assets Basic earning power- 0.02 0.01
Step by Step Solution
There are 3 Steps involved in it

Get step-by-step solutions from verified subject matter experts