

Question: Hi! I need help interpreting the results from this output. Nothing complex, just discussion points to help understand the data. Please try to create interpretations
Hi! I need help interpreting the results from this output. Nothing complex, just discussion points to help understand the data. Please try to create interpretations for each variable.
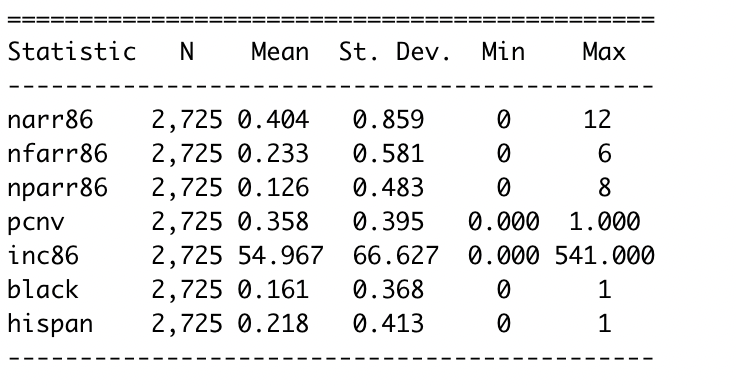
For example, inc86 has a very high standard deviation in which the mean is signifcantly smaller that the max. Why could that be?
Defined Variables
A data.frame with 2725 observations on 16 variables:
narr86: # times arrested, 1986
nfarr86: # felony arrests, 1986
nparr86: # property crme arr., 1986
pcnv: proportion of prior convictions
avgsen: avg sentence length, mos.
tottime: time in prison since 18 (mos.)
ptime86: mos. in prison during 1986
qemp86: # quarters employed, 1986
inc86: legal income, 1986, $100s
durat: recent unemp duration
black: =1 if black
hispan: =1 if Hispanic
born60: =1 if born in 1960
pcnvsq: pcnv^2
pt86sq: ptime86^2
inc86sq: inc86^2
The Output:
Step by Step Solution
There are 3 Steps involved in it

Get step-by-step solutions from verified subject matter experts