

Question: Hi, I need help learning how to graph the numbers listed as needed below. X -2.5 -2.3 -2.119 -1.9 -1 -O.667 -0.4 0.5 1 Y
Hi, I need help learning how to graph the numbers listed as needed below.
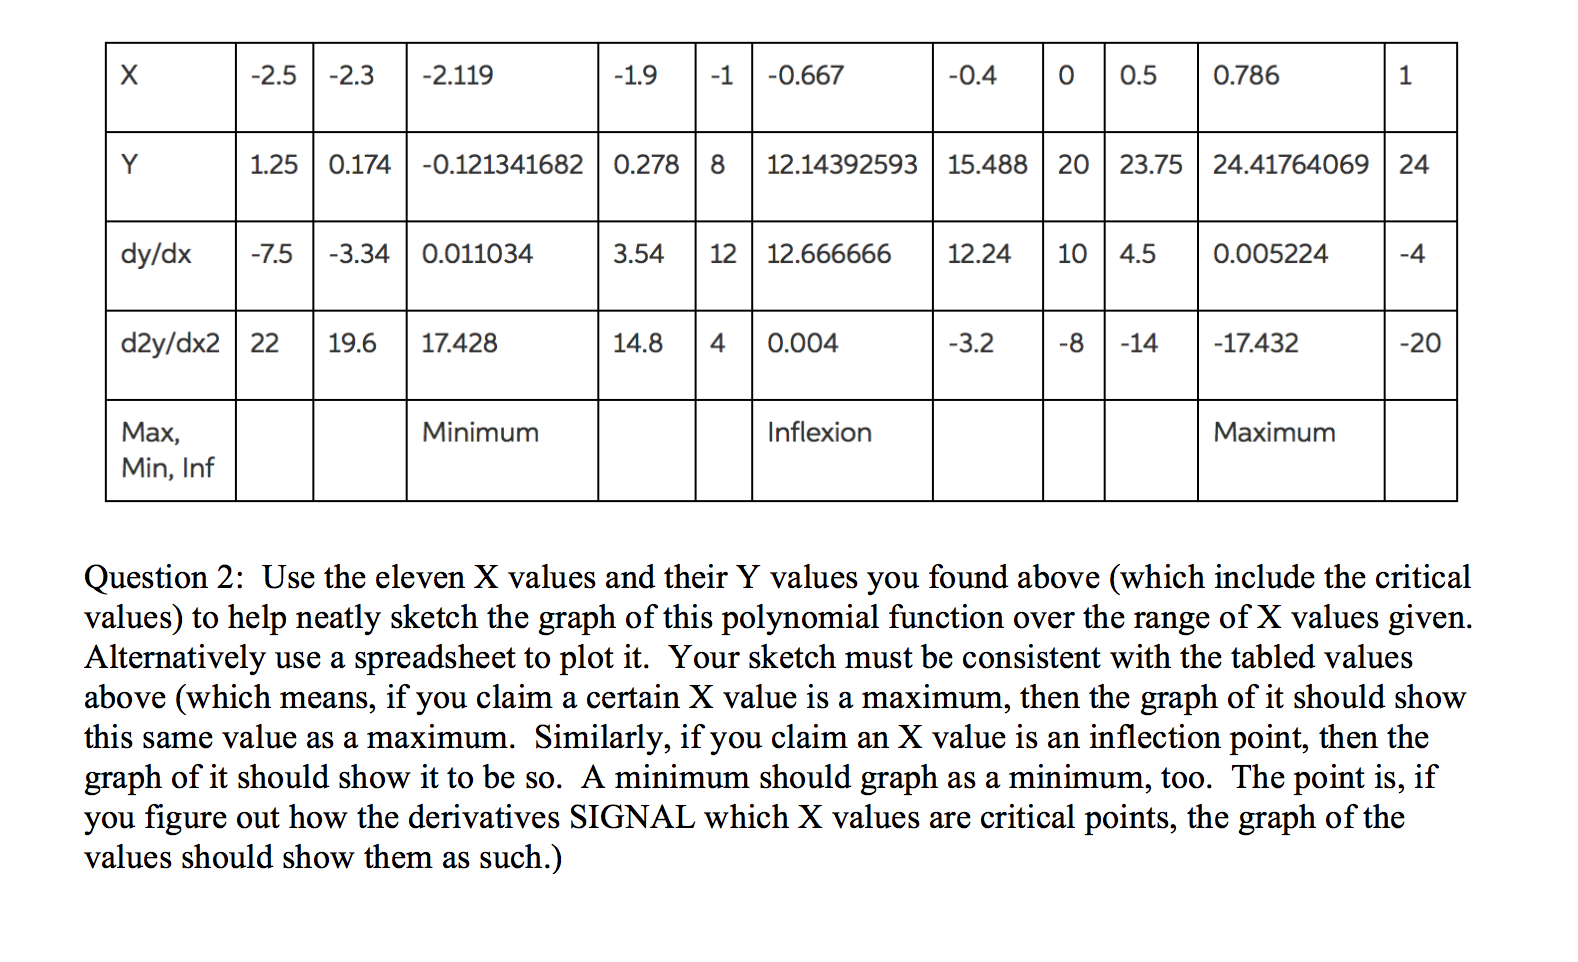
X -2.5 -2.3 -2.119 -1.9 -1 -O.667 -0.4 0.5 1 Y 1.25 0.174 0.121341682 0.278 8 1214392593 15.488 23.75 24.41764069 24 dy/dx 0011034 12.000000 0.000224 -4 d2y/dx2 22 19.6 17.423 14.8 0.004 -3.2 -14 -17.432 -20 Max, Minimum Inflexion Maximum Min, Inf Question 2: Use the eleven X values and their Y values you found above (which include the critical values) to help neatly sketch the graph of this polynomial function over the range of X values given. Alternatively use a spreadsheet to plot it. Your sketch must be consistent with the tabled values above (which means, if you claim a certain X value is a maximum, then the graph of it should show this same value as a maximum. Similarly, if you claim an X value is an inection point, then the graph of it should show it to be so. A minimum should graph as a minimum, too. The point is, if you gure out how the derivatives SIGNAL which X values are critical points, the graph of the values should show them as such.)
Step by Step Solution
There are 3 Steps involved in it

Get step-by-step solutions from verified subject matter experts