

Question: Hi I need help on what is the answer to this problems? Below is the question and other concerns will be in the comment section
Hi I need help on what is the answer to this problems? Below is the question and other concerns will be in the comment section. I hope you can help me and surely I will give you full positive feedback
..
.
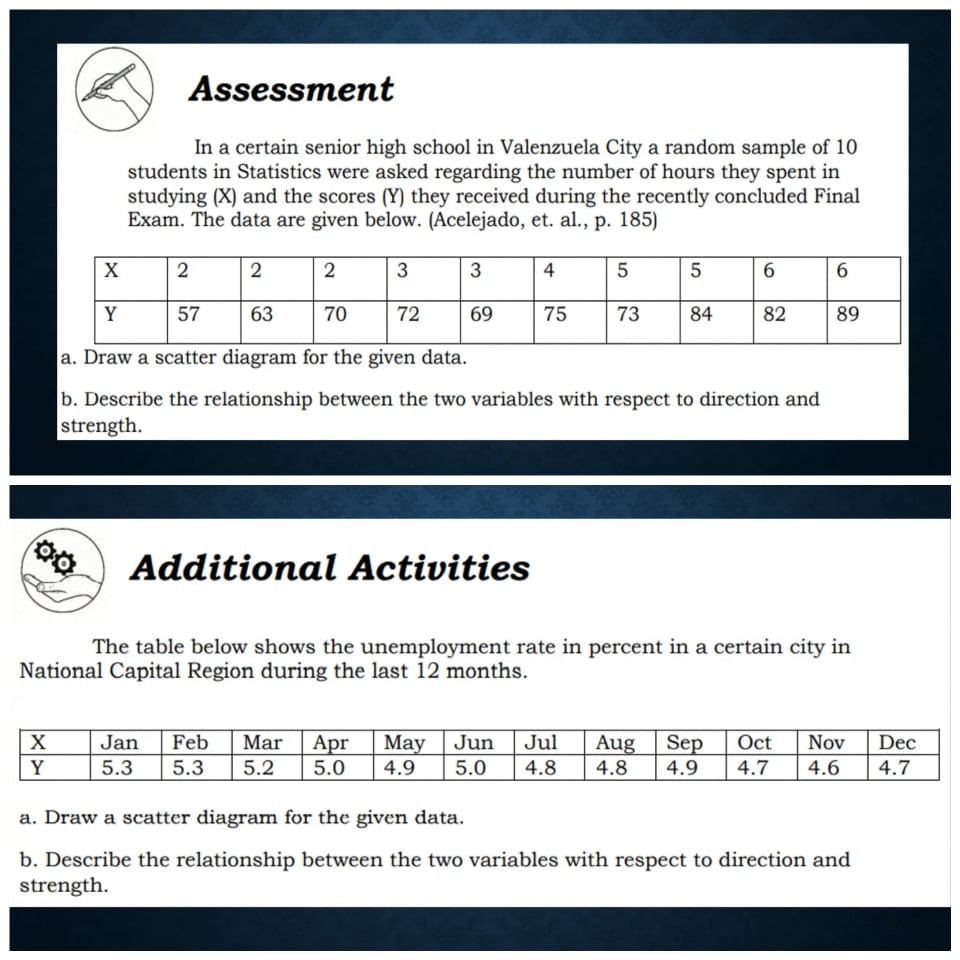
Assessment In a certain senior high school in Valenzuela City a random sample of 10 students in Statistics were asked regarding the number of hours the},r spent in studying [X] and the scores {Y} they received during the recently concluded Final Exam. The data are given below. [Acelejadd et. al., p. 185) mu-uuu a. Draw a scatter diagram for the given data. b. Describe the relationship between the two variables with respect to direction and strength. '3?\" Additional Activities \\1 The table below shows the unemployment rate in percent in a certain city in National Capital Region during the last 12 months. WWW-WIRE -m--mmlmmmm a. Draw a scatter diagram for the given data. b. Describe the relationship between the two variables with respect to direction and strength
Step by Step Solution
There are 3 Steps involved in it

Get step-by-step solutions from verified subject matter experts