

Question: Hi I need help with this question thanks! Question 2 The following is a small data set with 6 pair of observations. A scatterplot and
Hi I need help with this question thanks!
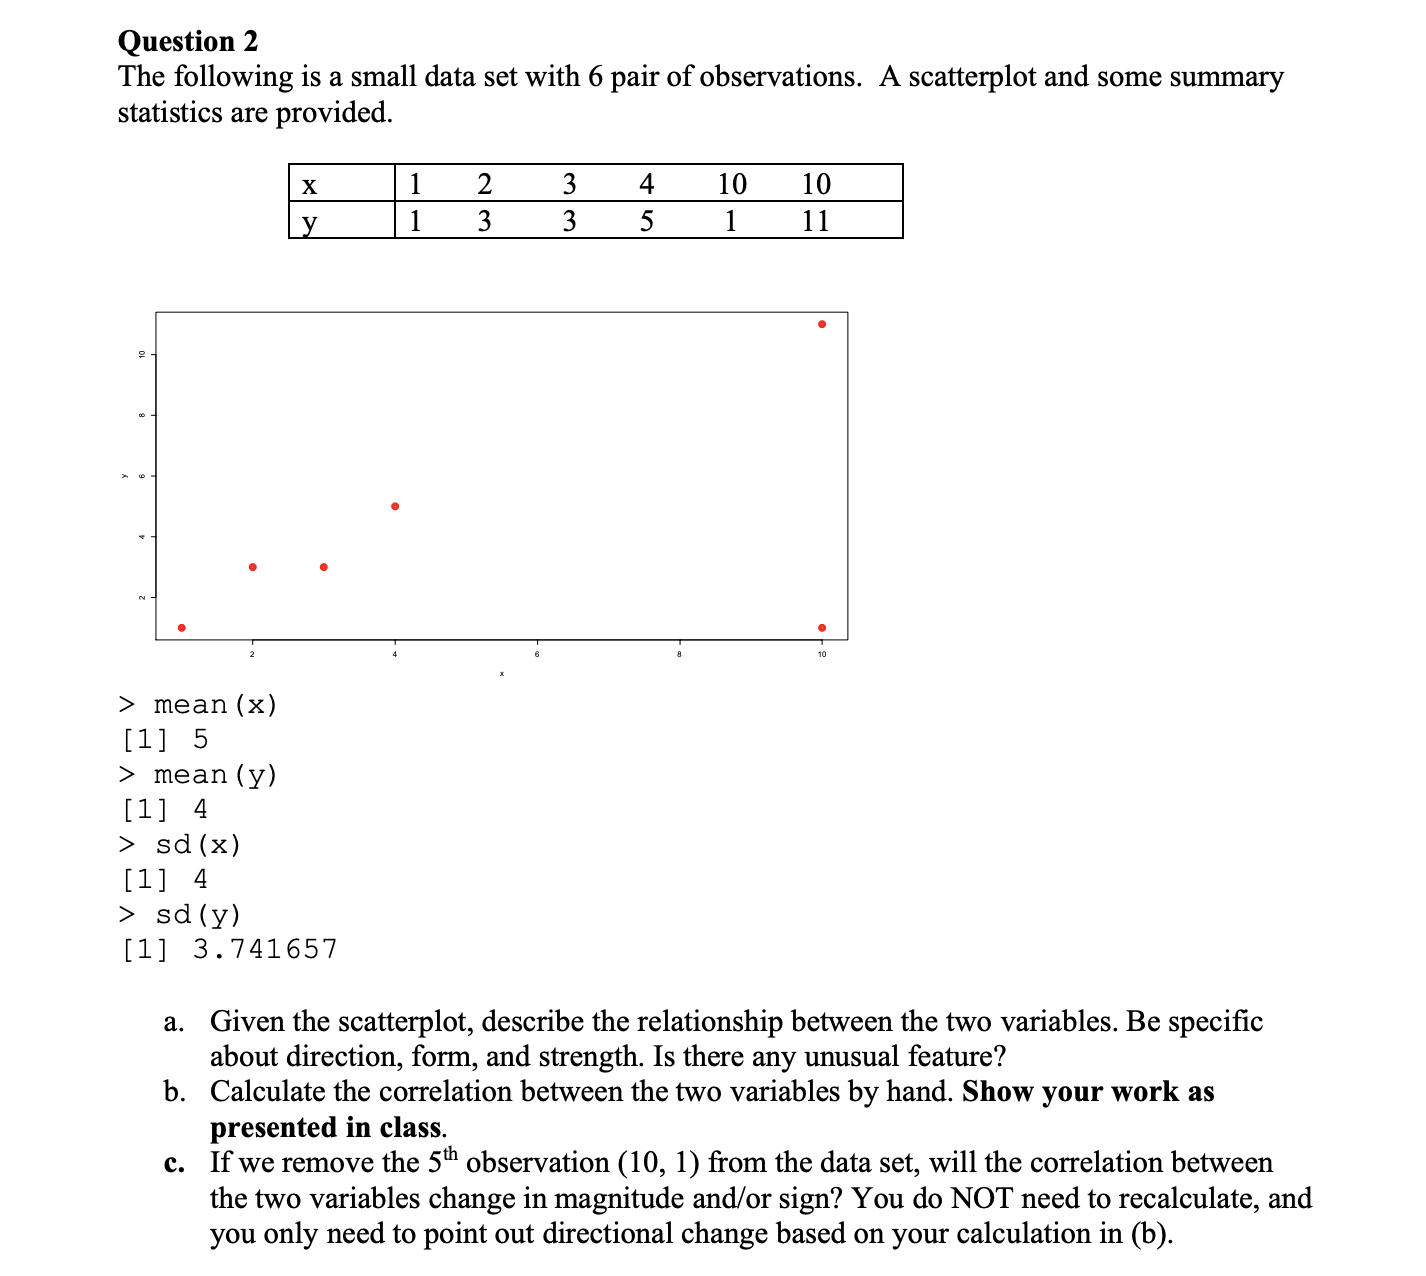
Question 2 The following is a small data set with 6 pair of observations. A scatterplot and some summary statistics are provided. -12341010 _ > mean(x) [l] 5 > mean(y) [1] 4 > sd(x) [l] 4 > sd(y) [1] 3.741657 a. Given the scatterplot, describe the relationship between the two variables. Be specic about direction, form, and strength. Is there any unusual feature? b. Calculate the correlation between the two variables by hand. Show your work as presented in class. c. If we remove the 5'31 observation (10, 1) from the data set, will the correlation between the two variables change in magnitude and/or sign? You do NOT need to recalculate, and you only need to point out directional change based on your calculation in (b)
Step by Step Solution
There are 3 Steps involved in it

Get step-by-step solutions from verified subject matter experts