

Question: Hi! I really need some help on this statistics question. I need to know the test statistic , as well as the P-value of the
Hi! I really need some help on this statistics question. I need to know the test statistic, as well as the P-value of the test statistic.
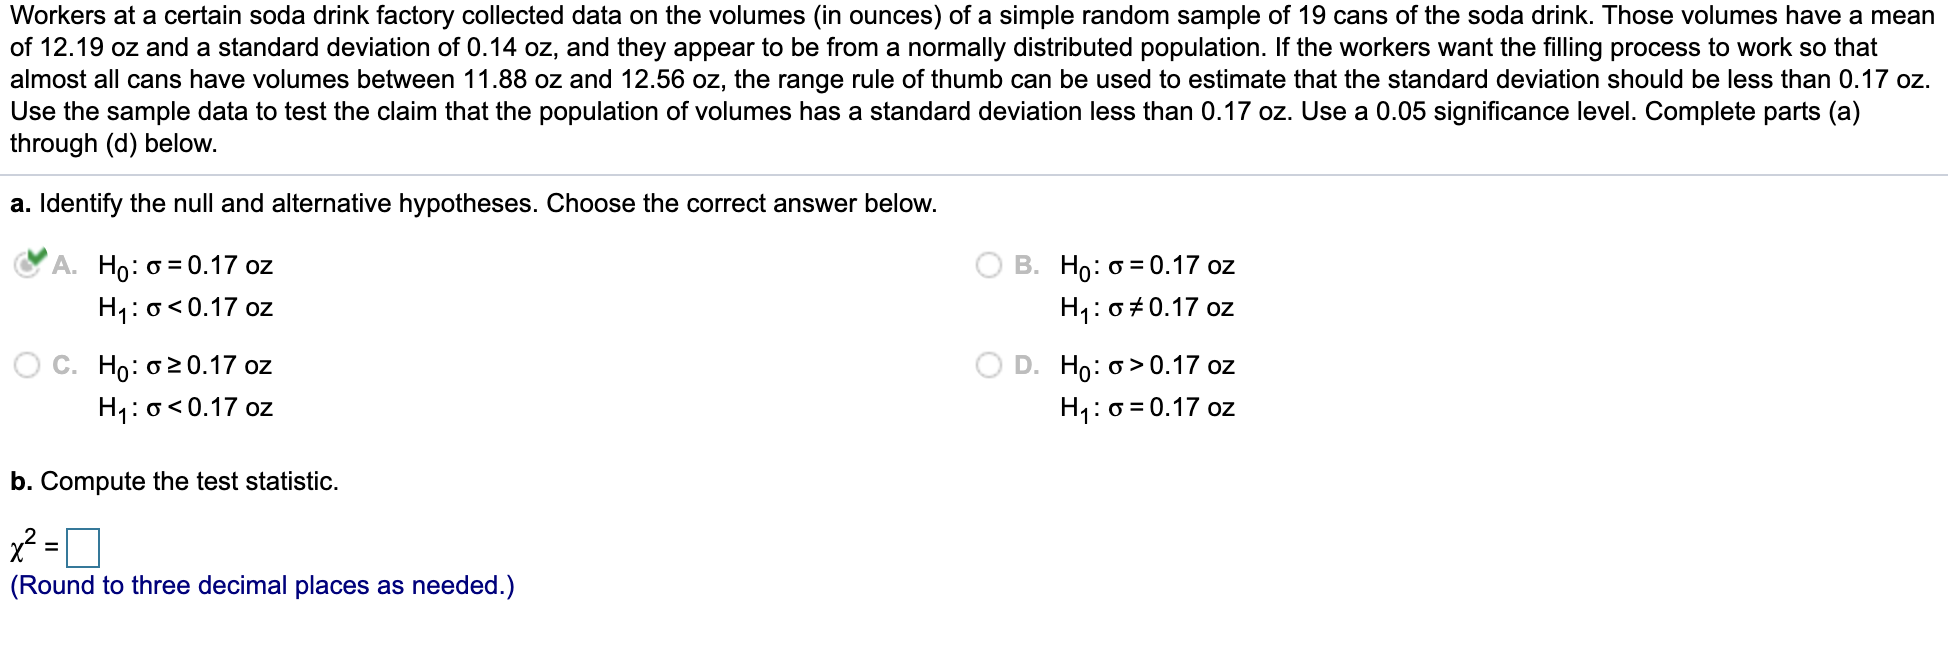
Workers at a certain soda drink factory collected data on the volumes (in ounces) of a simple random sample of 19 cans of the soda drink. Those volumes have a mean of 12.19 oz and a standard deviation of 0.14 oz, and they appear to be from a normally distributed population. If the workers want the lling process to work so that almost all cans have volumes between 11.88 oz and 12.56 oz, the range rule of thumb can be used to estimate that the standard deviation should be less than 0.17 oz. Use the sample data to test the claim that the population of volumes has a standard deviation less than 0.17 oz. Use a 0.05 signicance level. Complete parts (a) through (d) below. 3. Identify the null and alternative hypotheses. Choose the correct answer below. 3A. Ho:c=0.1702 B. Ho:o=0.1702 H1:o0.17oz H1:o
Step by Step Solution
There are 3 Steps involved in it

Get step-by-step solutions from verified subject matter experts