

Question: Hi! I'm doing a project for a statistics class. Basically, I need to convert the information into a table in word. I'm unsure if I
Hi! I'm doing a project for a statistics class. Basically, I need to convert the information into a table in word. I'm unsure if I need to include everything on this list so it displays information related to the hypothesis correctly. Can someone provide an example of what the table should like like from this generated information?
Hypothesis 2 (difference of means T-Test):
"In comparing individuals, women (variable: gender) will have warmer feelings towards
feminists (variable: V162096) than men."
The STATA data:
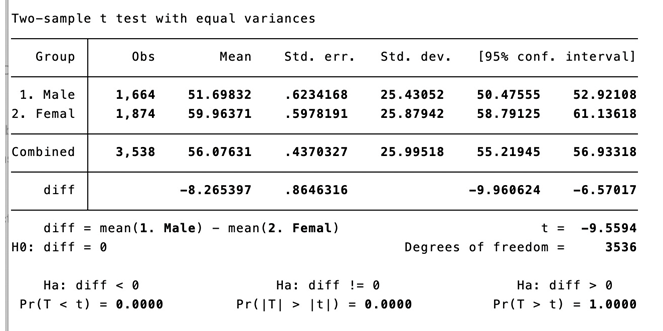
Two-sample t test with equal variances Group Obs Mean Std. err. Std. dev. [95% conf. interval] 1. Male 1, 664 51 . 69832 . 6234168 25.43052 50. 47555 52 . 92108 2. Femal 1, 874 59.96371 . 5978191 25. 87942 58. 79125 61. 13618 Combined 3,538 56. 07631 . 4370327 25 . 99518 55 . 21945 56. 93318 diff -8. 265397 . 8646316 -9.960624 -6. 57017 diff = mean (1. Male) - mean (2. Femal) t= -9.5594 HO: diff = 0 Degrees of freedom = 3536 Ha: diff 0 Pr(T |t|) = 0.0000 Pr(T > t) = 1.0080
Step by Step Solution
There are 3 Steps involved in it

Get step-by-step solutions from verified subject matter experts