

Question: Hi, I'm doing an assignment for my Managerial Finance class and I'm having a bit of trouble. Here's the prompt for the assignment: A manufacturer
Hi, I'm doing an assignment for my Managerial Finance class and I'm having a bit of trouble. Here's the prompt for the assignment:
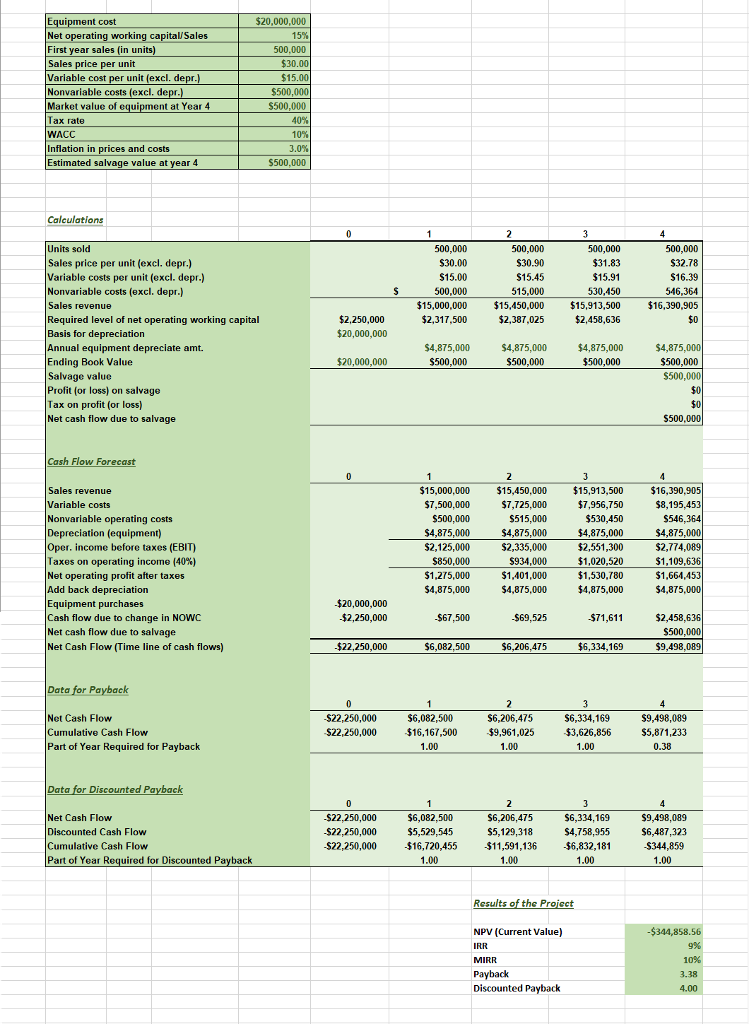
A manufacturer is planning to produce and sell a new product. It would cost $20 million at Year 0 to buy the equipment necessary to manufacture the product. The project would require net working capital at the beginning of each year in an amount equal to 15% of the year's projected sales; for example, NWC0 = 15%(Sales1). The product would sell for $30 per unit, and believes that variable costs would amount to $15 per unit. After Year 1, the sales price and variable costs will increase at the inflation rate of 3%. The project's fixed costs would be $500,000/year in Year 1 and would increase with inflation.
The products will be sold for 4 years. If the project is undertaken, it must be continued for the entire 4 years. The firm believes it could sell 500,000 units per year.
The equipment would be depreciated over using straight-line depreciation. The estimated market value of the equipment at the end of the projects 4-year life is $500,000. The federal-plus-state tax rate is 40%. Its cost of capital is 10%
1.) Develop a spreadsheet model, and use it to find the projects NPV, IRR, and payback.
2.) Now conduct a scenario analysis. Assume that there is a 25% probability that best-case conditions, with each of the variables discussed in Part b being 20% better than its base-case value, will occur. There is a 25% probability of worst-case conditions, with the variables 20% worse than base, and a 50% probability of base-case conditions. (Suppose the average CV of this company's projects is 2.0. Is this project more or less risky than the average project for this company?).
This is what I have so far in Excel for this problem:
And here's what I have for the Scenario Analysis:
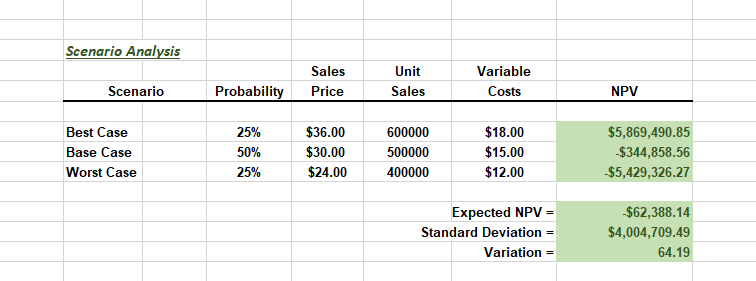
My issue is that it seems like all my budgeting is correct, but the variation(CV) in my scenario analysis seems way off. If anyone has any suggestions, or if someone could possibly try doing out this problem in Excel along with me to see if they got similar results I would greatly appreciate it! I'll be sure to thumbs up any resulting answers as well.
t cost $20,000,000 Net operating working capitali Sales First year sal Sales price per un Variable cost per unit (excl. depr Nonvariable costs (excl. de 500.000 $500,000 $500,000 ui WACC Inflation in prices and costs Estimated salvage value at $500,000 Calculations 500,000 500,000 500,000 Sales price per unit (excl. depr.) Variable costs per unit (excl. depr.) Nonvariable costs (excl. depr.) Sales revenue Required level of net operating working capital Basis for depreciation $30.00 $15.91 $16.39 546,364 $15,000,000 $15,450,000 $15,913,500 $16,390,905 $0 500,000 $2,458,636 $20,000,000 al equipment depreciate amt. $4,875,000 $500,000 $500,000 $500,000 $0 $0 500,000 $500,000 $500,000 Ending Book Value Salvage value Profit (or loss) on salvage $20,000,000 Net cash flow due to salvage Cash Flow Forecast $16,390,905 $8,195,4 Sales revenue Variable costs Nonvariable operating costs Depreciation (equipment) Oper. income before taxes (EBIT) Taxes on operating income (40%) Net operating profit after taxes $15,000,000 $15,450,000 15,913,500 $7,956,750 $530,450 $4,875,000 $2,551,300 $1,020,520 $1,530,780 $4,875,000 $7,500,000 $500,000 7,725.000 $546,364 $2,125,000 $850,000 $1,275,000 $4,875,000 $2,335,000 $934,000 $1,401,000 $4,875,000 $2,774,089 $1.109,636 $1,664,453 $4,875,000 d back depreciation $20,000,000 $2,250,000 ui Cash flow due to change in NOWC Net cash flow due to salvage Net Cash Flow (Time line of cash flows) $2,458,636 $500,000 $9,498.089 $67,500 $69,525 $22,250,000 $6,082,500 6,206,475 Net Cash Flow Cumulative Cash Flow Part of Year Required for Payback $22,250,000 $22,250,000 $6,082,500 $16,167,500 S6,206,475 $9,961,025 $6,334,169 $3,626,856 S9,498,089 S5,871,233 Data for Discounted Net Cash Flow Discounted Cash Flow Cumulative Cash Flow Part of Year Required for Discounted Pa $22,250,000 $22,250,000 $22,250,000 $6,082,500 $5,529,545 $16,720,455 11,591,136 $6,832,181 $9,498,089 $6,487,323 S344,859 S5,129,318 Results of the NPV (Current Value) IRR MIRR 9% 10%
Step by Step Solution
There are 3 Steps involved in it

Get step-by-step solutions from verified subject matter experts