

Question: Hi! I'm having a hard time understanding this table and the answers? A survey of college students was conducted during final exam week to assess
Hi! I'm having a hard time understanding this table and the answers?
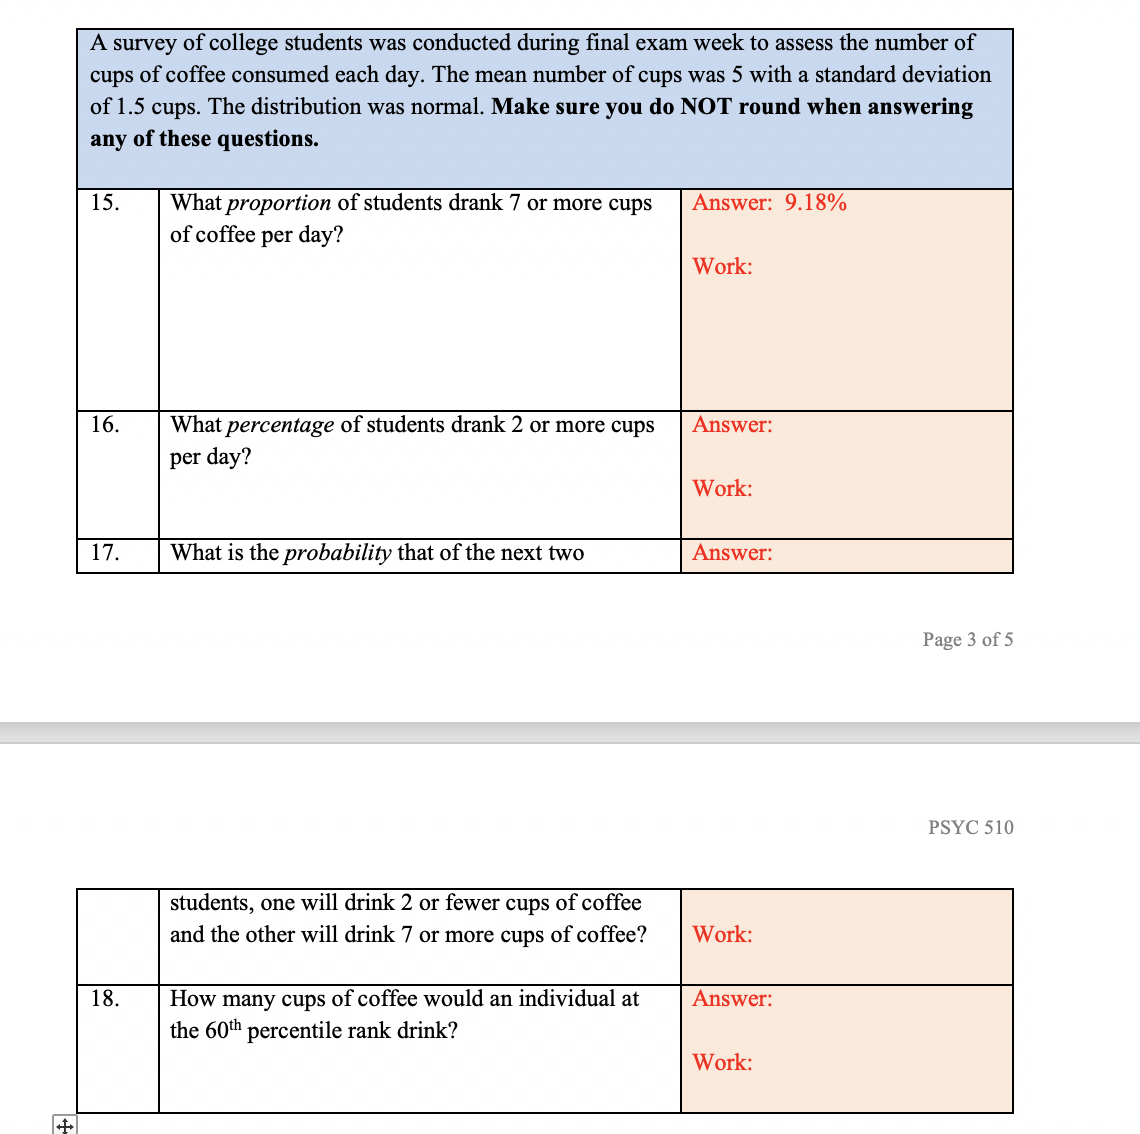
A survey of college students was conducted during final exam week to assess the number of cups of coffee consumed each day . The mean number of cups was 5 with a standard deviation of 1. 5 cups . The distribution was normal . Make sure you do NOT round when answering any of these questions . 15 . What proportion of students drank 7 or more cups Answer : 9. 18% of coffee per day ? Work : 16 . What percentage of students drank 2 or more cups Answer :" per day ? Work : 17 . What is the probability that of the next two Answer :" Page 3 of 5 PSYC 510 students , one will drink 2 or fewer cups of coffee and the other will drink 7 or more cups of coffee ? Work . 18 . How many cups of coffee would an individual at Answer :" the 60th percentile rank drink ?! Work
Step by Step Solution
There are 3 Steps involved in it

Get step-by-step solutions from verified subject matter experts