

Question: Hi I'm tryna answer this Question but I got it wrong can I have some help with over here please Math 111 Elementary Statistics Homework:
Hi I'm tryna answer this Question but I got it wrong can I have some help with over here please
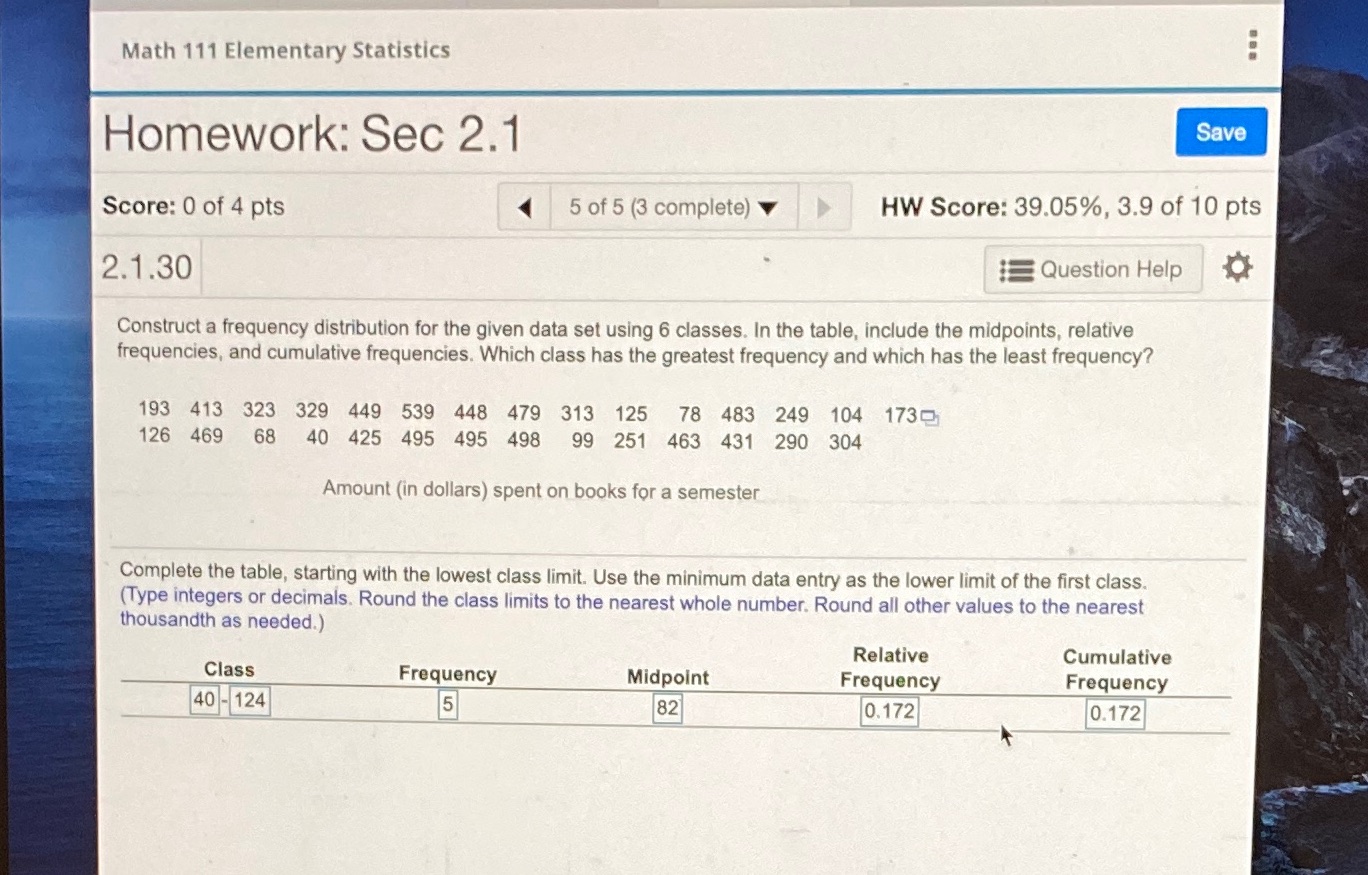
Math 111 Elementary Statistics Homework: Sec 2.1 Score: 0 0! 4 pts { 5 of 5 (a complete) it tr HW Score: 39.05%, 3.9 of 10 pts 2.1.30 ' 5\" Question Help 'a' Construct a frequency distribution for the given data set using 6 classes. In the table. include the midpoints. relative frequencies. and cumulative frequencies. Which class has the greatest frequency and which has the least frequency? 193 413 323 329 449 539 448 479 313 125 7B 433 249 104 1735. 126 469 68 40 425 495 495 498 99 251 463 431 290 304 Amount (in dollars) spent on books for a semester Complete the table. starting with the lowest class limit. Use the minimum data entry as the lower limit of the rst class. (pre integers or decimals. Round the class limits to the nearest whole number. Round all other values to the nearest thousandth as needed.) Relative Cumulative Class Frequency Midpoint Frequency Frequency
Step by Step Solution
There are 3 Steps involved in it

Get step-by-step solutions from verified subject matter experts