

Question: Hi need some help with solving this project. Please help me with the answers that need to go into the orange color part below. Thanks

Hi need some help with solving this project.
Please help me with the answers that need to go into the orange color part below.
Thanks
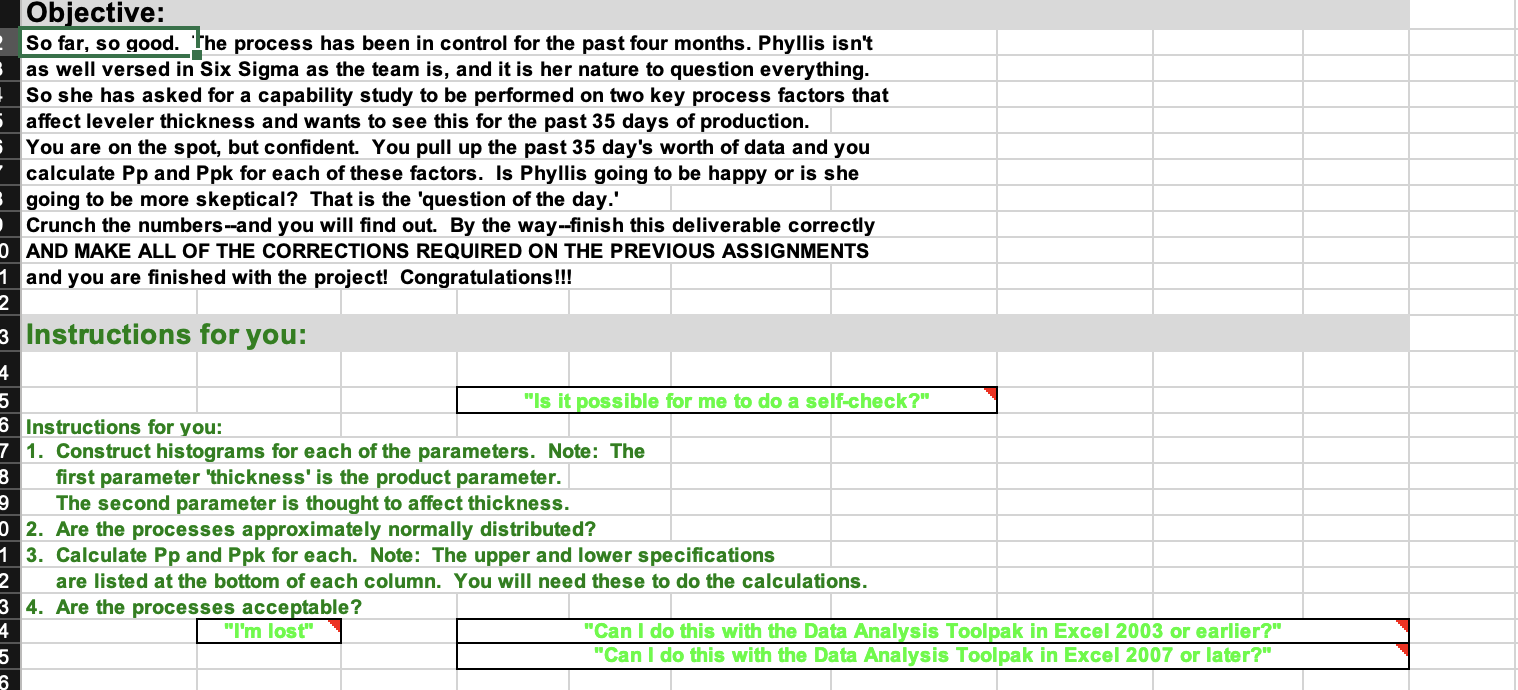
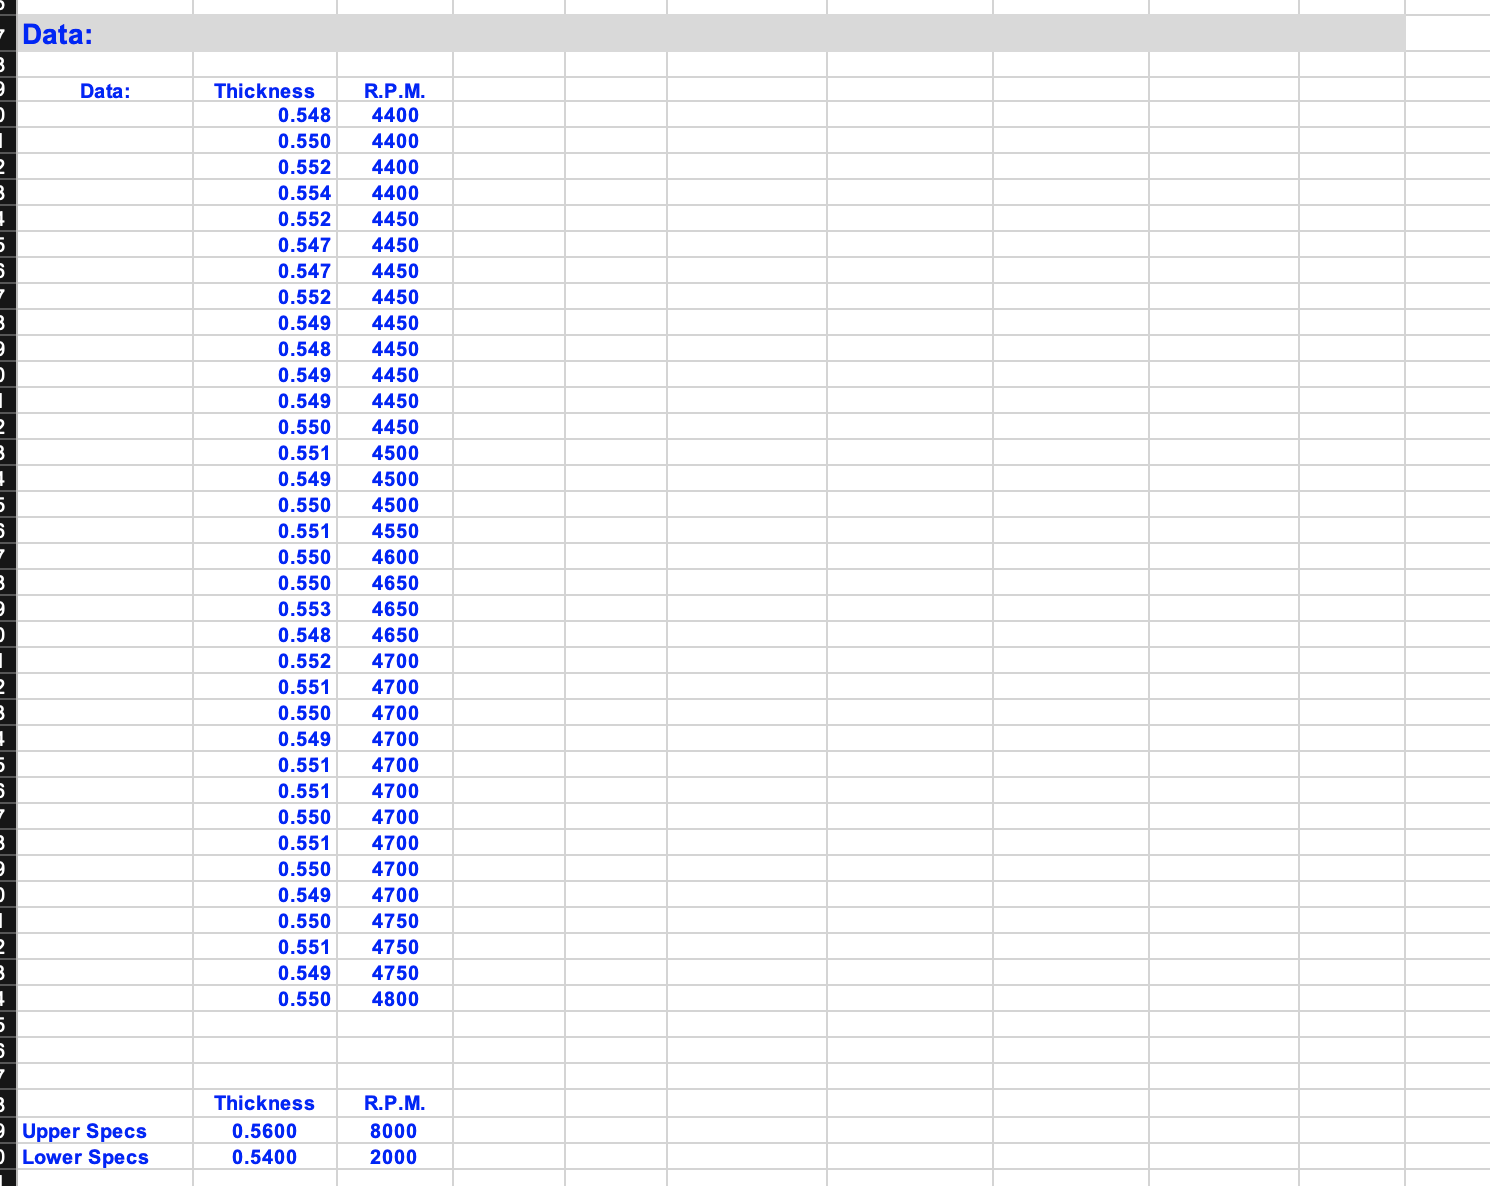
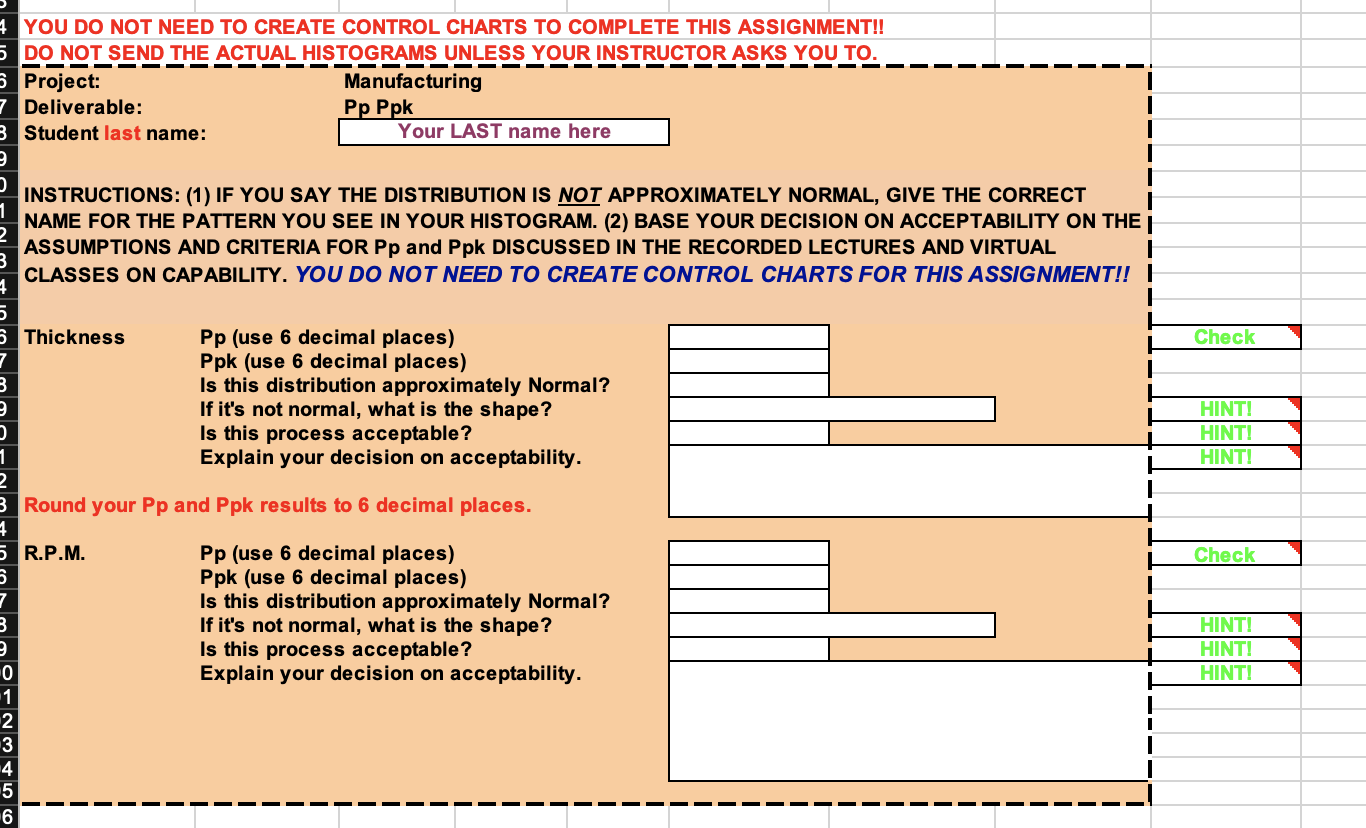
Ob'ective: So far. so good. 'Ihe process has been in control for the past four months. Phyllis isn't as well versed in Six Sigma as the team is. and it is her nature to question everything. So she has asked for a capability study to be performed on two key process factors that affect leveler thickness and wants to see this for the past 35 days of production. You are on the spotI but condent. You pull up the past 35 day's worth of data and you calculate Pp and Ppk for each of these factors. ls Phyllis going to be happy or is she going to be more skeptical? That is the 'question of the day.' Crunch the numbersand you will nd out. By the waynish this deliverable correctly AND MAKE ALL OF THE CORRECTIONS REQUIRED ON THE PREVIOUS ASSIGNMENTS and you are nished with the project! Congratulationslll Instructions for you: Instructions for you: 1. Construct histograms for each of the parameters. Note: The rst parameter lthickness' is the product parameter. The second parameter is thought to affect thickness. Are the processes approximately normally distributed? Calculate Pp and Ppk for each. Note: The upper and lower specications are listed at the bottom of each column. You will need these to do the calculations. 4. Are the processes acce%ble? P.\" Data: Data: Thickness R.P.M. 0.548 4400 0.550 4400 0.552 4400 0.554 4400 0.552 4450 0.547 4450 0.547 4450 0.552 4450 0.549 4450 0.548 4450 0.549 4450 0.549 4450 0.550 4450 0.551 4500 0.549 4500 0.550 4500 0.551 4550 0.550 4600 0.550 4650 0.553 4650 0.548 4650 0.552 4700 0.551 4700 0.550 4700 0.549 4700 0.551 4700 0.551 4700 0.550 4700 0.551 4700 0.550 4700 0.549 4700 0.550 4750 0.551 4750 0.549 4750 0.550 4800 Thickness R.P.M. Upper Specs 0.5600 8000 Lower Specs 0.5400 2000YOU DO NOT NEED TO CREATE CONTROL CHARTS TO COMPLETE THIS ASSIGNMENT!! DO NOT SEND THE ACTUAL HISTOGRAMS UNLESS YOUR INSTRUCTOR ASKS YOU TO. Project: Manufacturing Deliverable: Pp Ppk Student last name: Your LAST name here INSTRUCTIONS: (1) IF YOU SAY THE DISTRIBUTION IS NOT APPROXIMATELY NORMAL, GIVE THE CORRECT NAME FOR THE PATTERN YOU SEE IN YOUR HISTOGRAM. (2) BASE YOUR DECISION ON ACCEPTABILITY ON THE | ASSUMPTIONS AND CRITERIA FOR Pp and Ppk DISCUSSED IN THE RECORDED LECTURES AND VIRTUAL CLASSES ON CAPABILITY. YOU DO NOT NEED TO CREATE CONTROL CHARTS FOR THIS ASSIGNMENT!! Thickness Pp (use 6 decimal places) Check Ppk (use 6 decimal places) Is this distribution approximately Normal? If it's not normal, what is the shape? HINT! Is this process acceptable? HINT! Explain your decision on acceptability. HINT! Round your Pp and Ppk results to 6 decimal places. R.P.M. Pp (use 6 decimal places) Check Ppk (use 6 decimal places) Is this distribution approximately Normal? If it's not normal, what is the shape? HINT! Is this process acceptable? HINT! Explain your decision on acceptability. HINT! 6
Step by Step Solution
There are 3 Steps involved in it

Get step-by-step solutions from verified subject matter experts