

Question: hi please help me answer this question. please provide the step calculation, formula and clear writing. a) The following table shows information scored by students
hi please help me answer this question. please provide the step calculation, formula and clear writing.
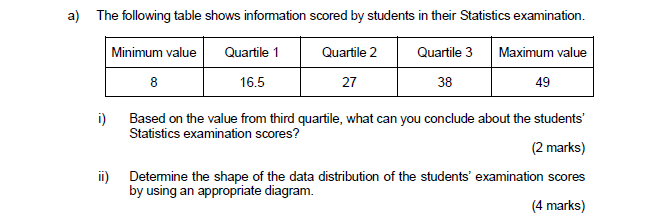
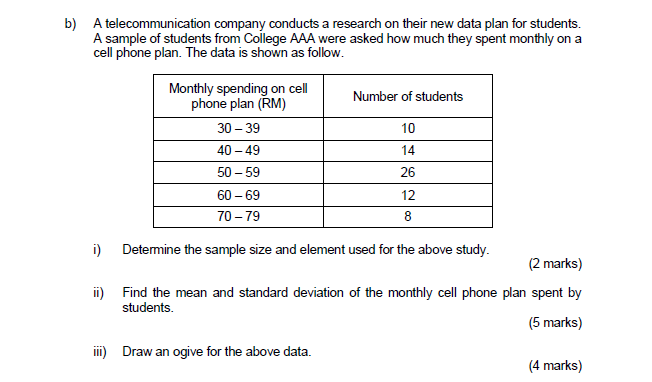
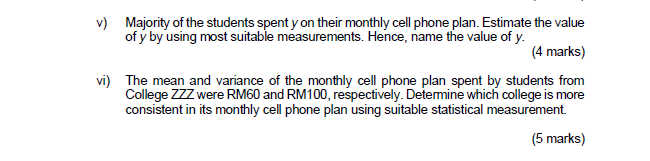
a) The following table shows information scored by students in their Statistics examination. Minimum value Quartile 1 Quartile 2 Quartile 3 Maximum value 8 16.5 27 38 49 Based on the value from third quartile, what can you conclude about the students' Statistics examination scores? (2 marks) ii) Determine the shape of the data distribution of the students' examination scores by using an appropriate diagram. (4 marks)b) A telecommunication company conducts a research on their new data plan for students. A sample of students from College AAA were asked how much they spent monthly on a cell phone plan. The data is shown as follow. Monthly spending on cell phone plan (RM) Number of students 30 -39 10 40 -49 14 50 -59 26 60 -69 12 70-79 8 i) Determine the sample size and element used for the above study. (2 marks) ii) Find the mean and standard deviation of the monthly cell phone plan spent by students. (5 marks) iii) Draw an ogive for the above data. (4 marks)v) Majority of the students spent y on their monthly cell phone plan. Estimate the value of y by using most suitable measurements. Hence, name the value of y. (4 marks) vi) The mean and variance of the monthly cell phone plan spent by students from College ZZZ were RM60 and RM100, respectively. Determine which college is more consistent in its monthly cell phone plan using suitable statistical measurement
Step by Step Solution
There are 3 Steps involved in it

Get step-by-step solutions from verified subject matter experts