

Question: Hi, please help me solve the question. Need do the solution how to get the answer, thanks. No only provide the answer, thank you very
Hi, please help me solve the question. Need do the solution how to get the answer, thanks. No only provide the answer, thank you very much.
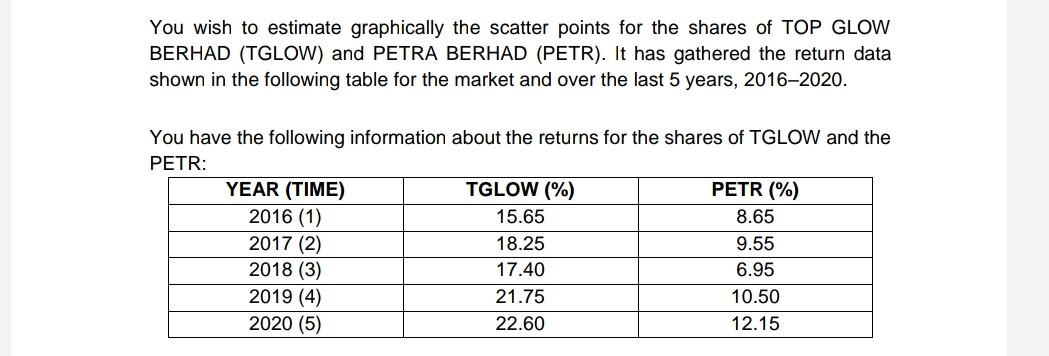
You wish to estimate graphically the scatter points for the shares of TOP GLOW BERHAD (TGLOW) and PETRA BERHAD (PETR). It has gathered the return data shown in the following table for the market and over the last 5 years, 20162020. You have the following information about the returns for the shares of TGLOW and the PETR: YEAR (TIME) TGLOW (%) PETR (%) 2016 (1) 15.65 8.65 2017 (2) 18.25 9.55 2018 (3) 17.40 6.95 2019 (4) 21.75 10.50 2020 (5) 22.60 12.15 b) Calculate the expected return, variance and standard deviation for the stocks. (11 marks) 3
Step by Step Solution
There are 3 Steps involved in it

Get step-by-step solutions from verified subject matter experts