

Question: Hi, please help to correct all the red marks below which was wrong, thank you. 1. PepsiCo Revenues ($ billions), 2014 to 2019 Quarter 2014
Hi, please help to correct all the red marks below which was wrong, thank you.
1. PepsiCo Revenues ($ billions), 2014 to 2019
| Quarter | 2014 | 2015 | 2016 | 2017 | 2018 | 2019 |
|---|---|---|---|---|---|---|
| Quarter 1 | 12.62 | 12.22 | 11.86 | 12.05 | 12.56 | 12.88 |
| Quarter 2 | 16.89 | 15.92 | 15.40 | 15.71 | 16.09 | 16.45 |
| Quarter 3 | 17.22 | 16.33 | 16.03 | 16.24 | 16.48 | 17.19 |
| Quarter 4 | 19.95 | 18.58 | 19.52 | 19.53 | 19.52 | 20.64 |
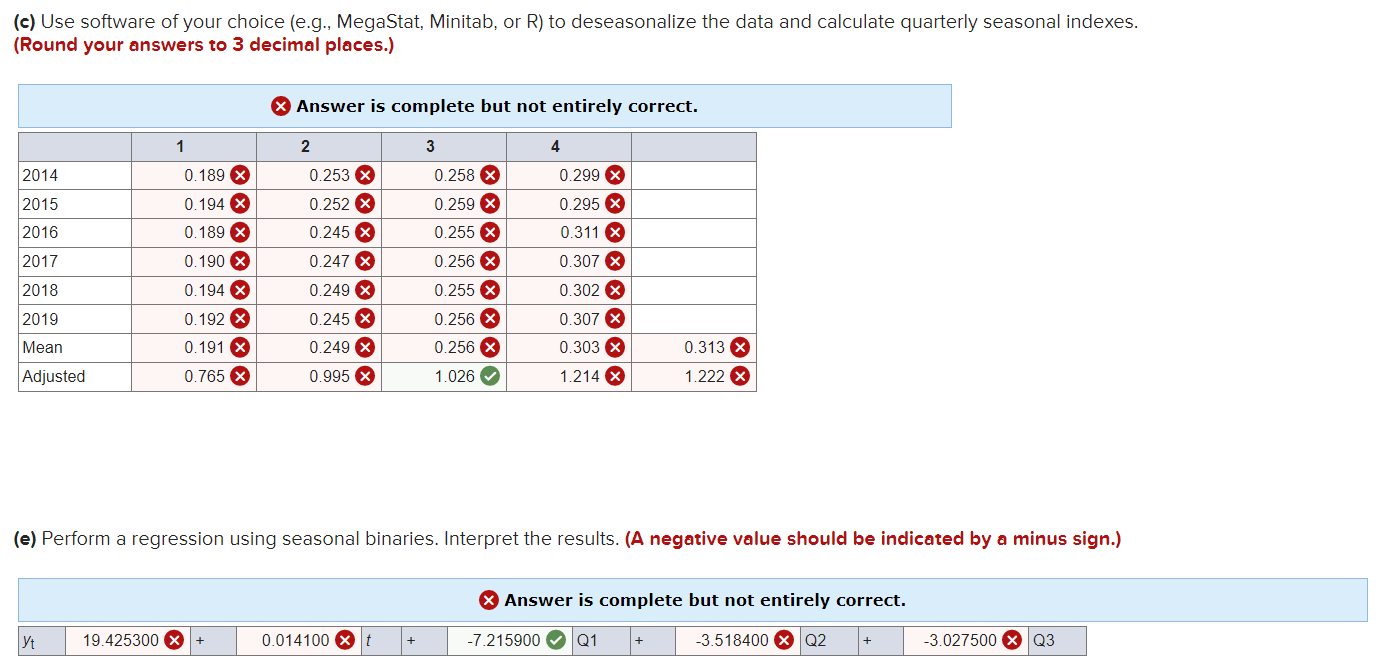
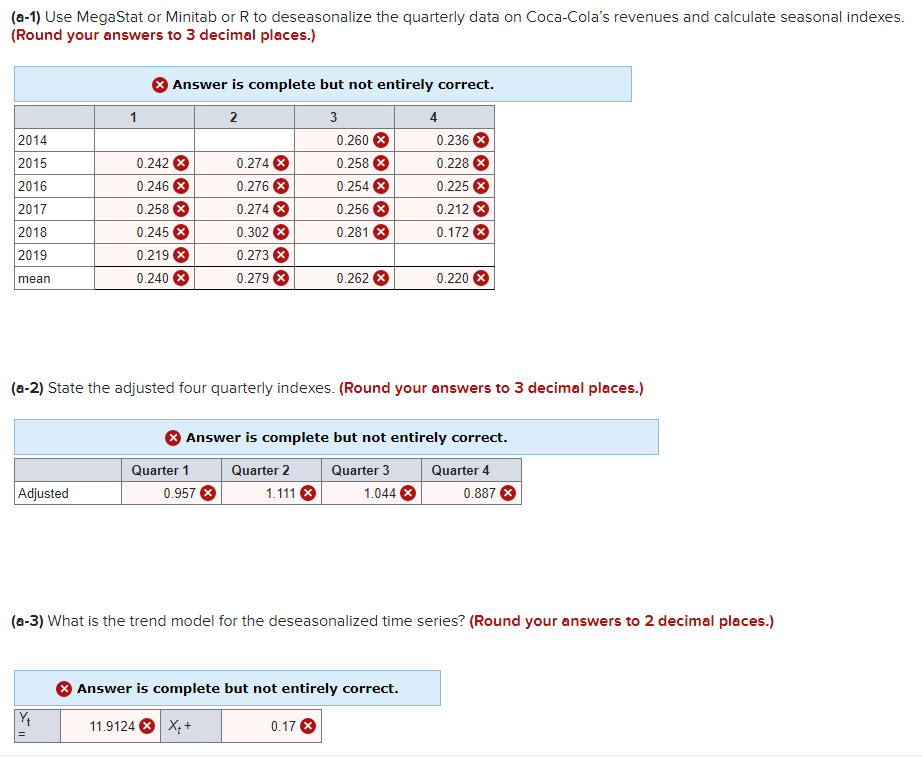
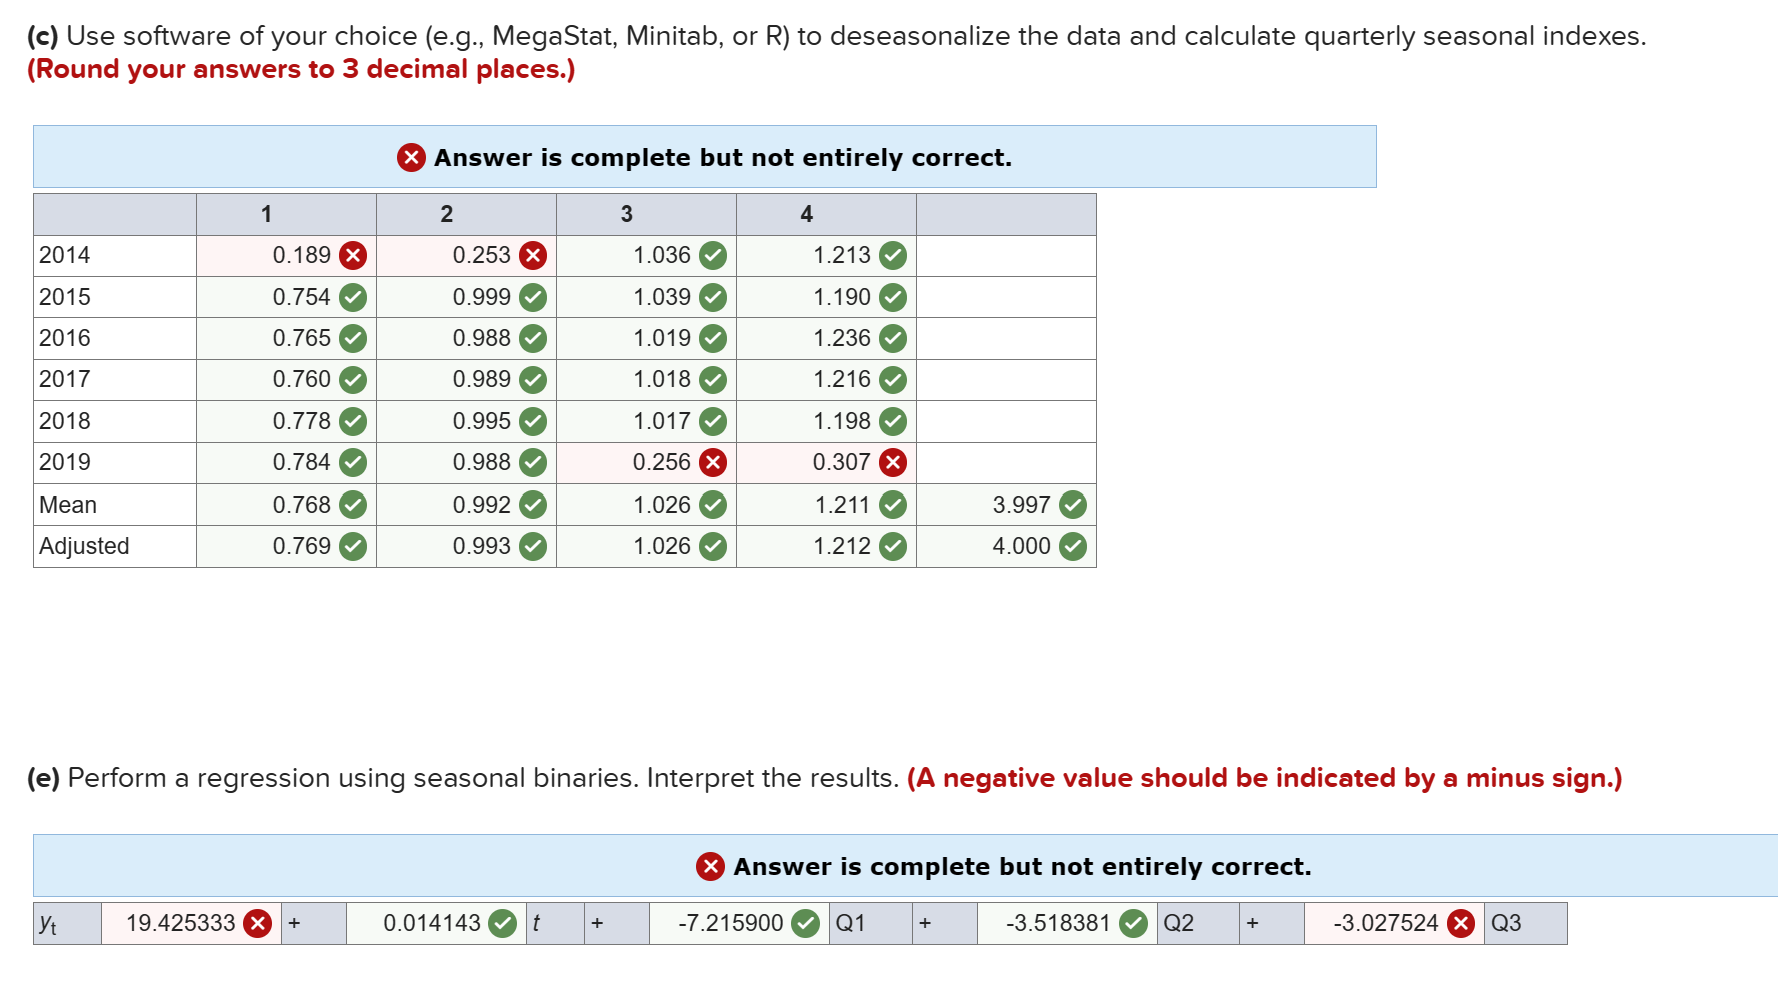
(c) Use software of your choice (e.g., MegaStat, Minitab, or R) to deseasonalize the data and calculate quarterly seasonal indexes. (Round your answers to 3 decimal places.) X Answer is complete but not entirely correct. 1 2 3 4 2014 0. 189 X 0.253 X 0.258 X 0.299 X 2015 0. 194 X 0.252 X 0.259 X 0.295 X 2016 0. 189 X 0.245 X 0.255 X 0.311 X 2017 0. 190 X 0.247 X 0.256 X 0.307 X 2018 0. 194 X 0.249 X 0.255 X 0.302 X 2019 0. 192 X 0.245 X 0.256 X 0.307 X Mean 0. 191 X 0.249 X 0.256 X 0.303 X 0.313 X Adjusted 0.765 X 0.995 X 1.026 1.214 X 1.222 X (e) Perform a regression using seasonal binaries. Interpret the results. (A negative value should be indicated by a minus sign.) x Answer is complete but not entirely correct. yt 19.425300 X + 0.014100 X t + -7.215900 Q1 + -3.518400 X Q2 + -3.027500 X Q3[a- Use MegaStat or Minitab or R to deseascnalize the quarterly data on CecaCola's revenues and calculate seasonal indexes. [Round your answers to 3 decimal places.) 6 Answer is complete but not entirely correct. 1 2 3 4 2014 0.200 6 0.2309 2015 0.2429 0.2249 0.2536 0.2236 2010 0.2459 0.2209 0.2546 0.2259 2017' 0.2536 0.2246 0.2506 0.212 6 2010 0.245 9 0.302 9 0.2016 0.122 6 2019 0.2109 0.2239 mean 0.240 9 0.229 9 0.202 6 0.220 6 [a-ZII State the adjusted four quarterly indexes. [Round your answers to 3 decimal places.) 9 Answer is complete but not entirely correct. Quarter 1 Quarter 2 Quarter 3 Quarterd Adjusted 0.9526 1.1116 1.0446 0.3326 [a-BII What is the trend model for the deseasonalized time series? (Round your answers to 2 decimal places] 0 Answer is complete but not entirely correct. '5 ' 11.91246'X 0.179 (c) Use software of your choice (e.g., MegaStat, Minitab, or R) to deseasonalize the data and calculate quarterly seasonal indexes. (Round your answers to 3 decimal places.) 0 Answer is complete but not entirely correct. 1 2 3 4 2014 0.189 9 0.253 0 1.036 9 1.213 9 2015 0.754 9 0.999 a 1.039 9 1.190 9 2016 0.765 9 0.988 a 1.019 9 1.236 9 2017 0.760 9 0.989 9 1.018 a 1.216 a 2013 0.778 9 0.995 a 1.017 9 1.198 9 2019 0.784 9 0.988 O 0.256 a 0.307 0 Mean 0.768 O 0.992 0 1.026 a 1.211 0 3.997 0 Adjusted 0.769 9 0.993 a 1.026 9 1.212 9 4.000 9 (e) Perform a regression using seasonal binaries. Interpret the results. (A negative value should be indicated by a minus sign.) 0 Answer is complete but not entirely correct. yt 194253330 + 0.0141439 t + 72159009 Q1 + 415183810 Q2 + 3.0275249 03
Step by Step Solution
There are 3 Steps involved in it

Get step-by-step solutions from verified subject matter experts