

Question: hi please i need help with this Quantitive Finance problem. My seven stocks are Amazon, Tesla, Microsoft, Walmart, Goldman Sachs, Home Depot and Mcdonalds. Should
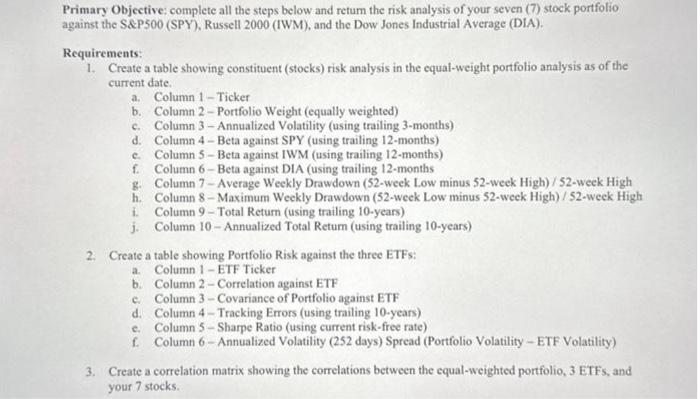
against the S\&P500 (SPY), Russell 2000 (IWM), and the Dow Jones Industrial Average (DIA). Requirements: 1. Create a table showing constituent (stocks) risk analysis in the equal-weight portfolio analysis as of the current date. a. Column 1 - Ticker b. Column 2 - Portfolio Weight (equally weighted) c. Column 3 - Annualized Volatility (using trailing 3-months) d. Column 4 - Beta against SPY (using trailing 12 -months) c. Column 5 - Beta against IWM (using trailing 12-months) f. Column 6 - Beta against DIA (using trailing 12-months g. Column 7 - Average Weekly Drawdown (52-week Low minus 52-week High) / 52-week High h. Column 8-Maximum Weekly Drawdown (52-week Low minus 52-week High) / 52-week High i. Column 9 - Total Return (using trailing 10-years) j. Column 10 - Annualized Total Retum (using trailing 10-years) 2. Create a table showing Portfolio Risk against the three ETFs: a. Column 1 - ETF Ticker b. Column 2 - Correlation against ETF c. Column 3 - Covariance of Portfolio against ETF d. Column 4 - Tracking Errors (using trailing 10-years) c. Column 5-Sharpe Ratio (using current risk-free rate) f. Column 6 - Annualized Volatility (252 days) Spread (Portfolio Volatility - ETF Volatility) 3. Create a correlation matrix showing the correlations between the equal-weighted portfolio, 3 ETFs, and your 7 stocks
Step by Step Solution
There are 3 Steps involved in it

Get step-by-step solutions from verified subject matter experts