

Question: Hi! Please use the data below from SPSS picture to answer the following questions. You don't even have to be totally sure of the answers,
Hi! Please use the data below from SPSS picture to answer the following questions. You don't even have to be totally sure of the answers, I just literally have no idea what to put and need to submit something. Thanks in advance!
1. What is the direction of the correlation?
2. What is the value of the correlation?
3. What percentage of variance do stats grade account for in the pretest scores?
4. Describe the relationship using the appropriate labels and terminology.
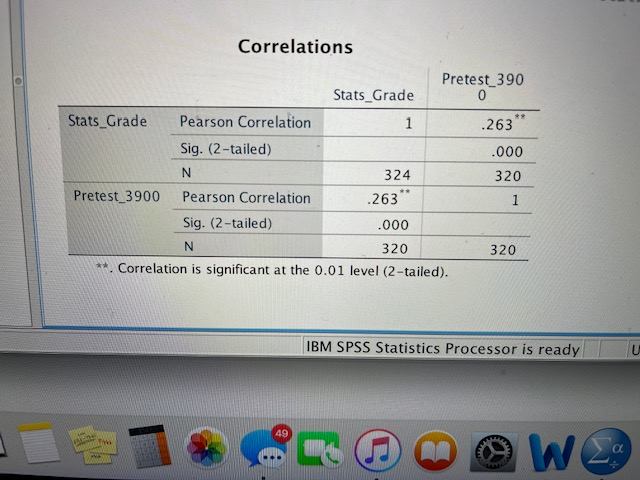
Correlations Pretest 390 Stats_Grade 0 Stats_Grade Pearson Correlation 1 263 Sig. (2-tailed) 000 N 324 320 Pretest_3900 Pearson Correlation 263 1 Sig. (2-tailed) 000 N 320 320 **. Correlation is significant at the 0.01 level (2-tailed). IBM SPSS Statistics Processor is ready 49
Step by Step Solution
There are 3 Steps involved in it

Get step-by-step solutions from verified subject matter experts