

Question: HI, PLZ ANSWER THE DATA EXCEL SHEETS ARE ON THIS DRIVE LINK https://drive.google.com/drive/folders/1_dXh0PfmP5KD4EB0GyVLOuCEnkiQTkpc?usp=sharing Q.No. 1 a. We had a sample size of n = 8.
HI, PLZ ANSWER
THE DATA EXCEL SHEETS ARE ON THIS DRIVE LINK
https://drive.google.com/drive/folders/1_dXh0PfmP5KD4EB0GyVLOuCEnkiQTkpc?usp=sharing
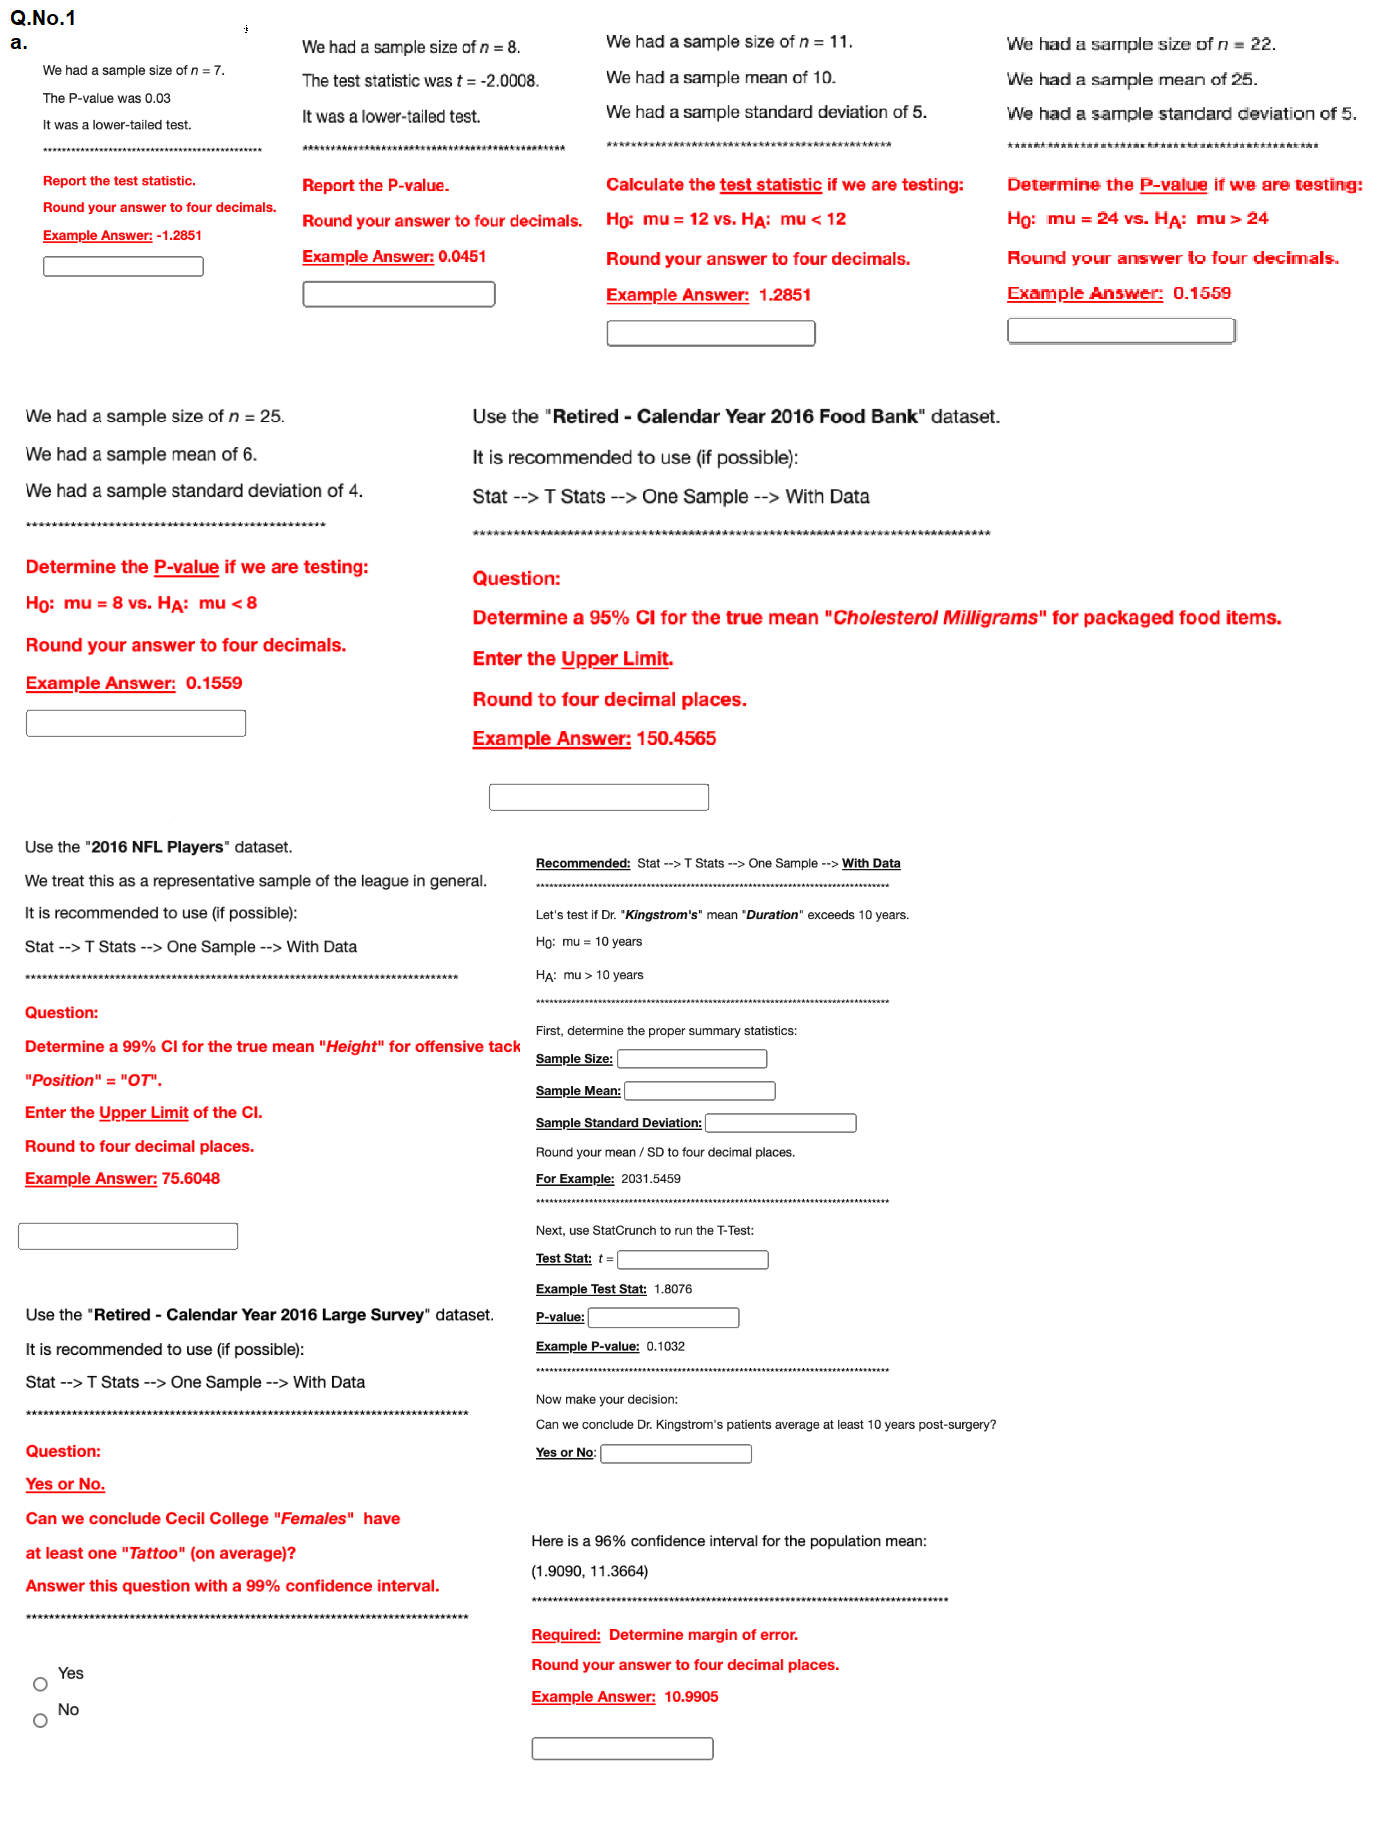
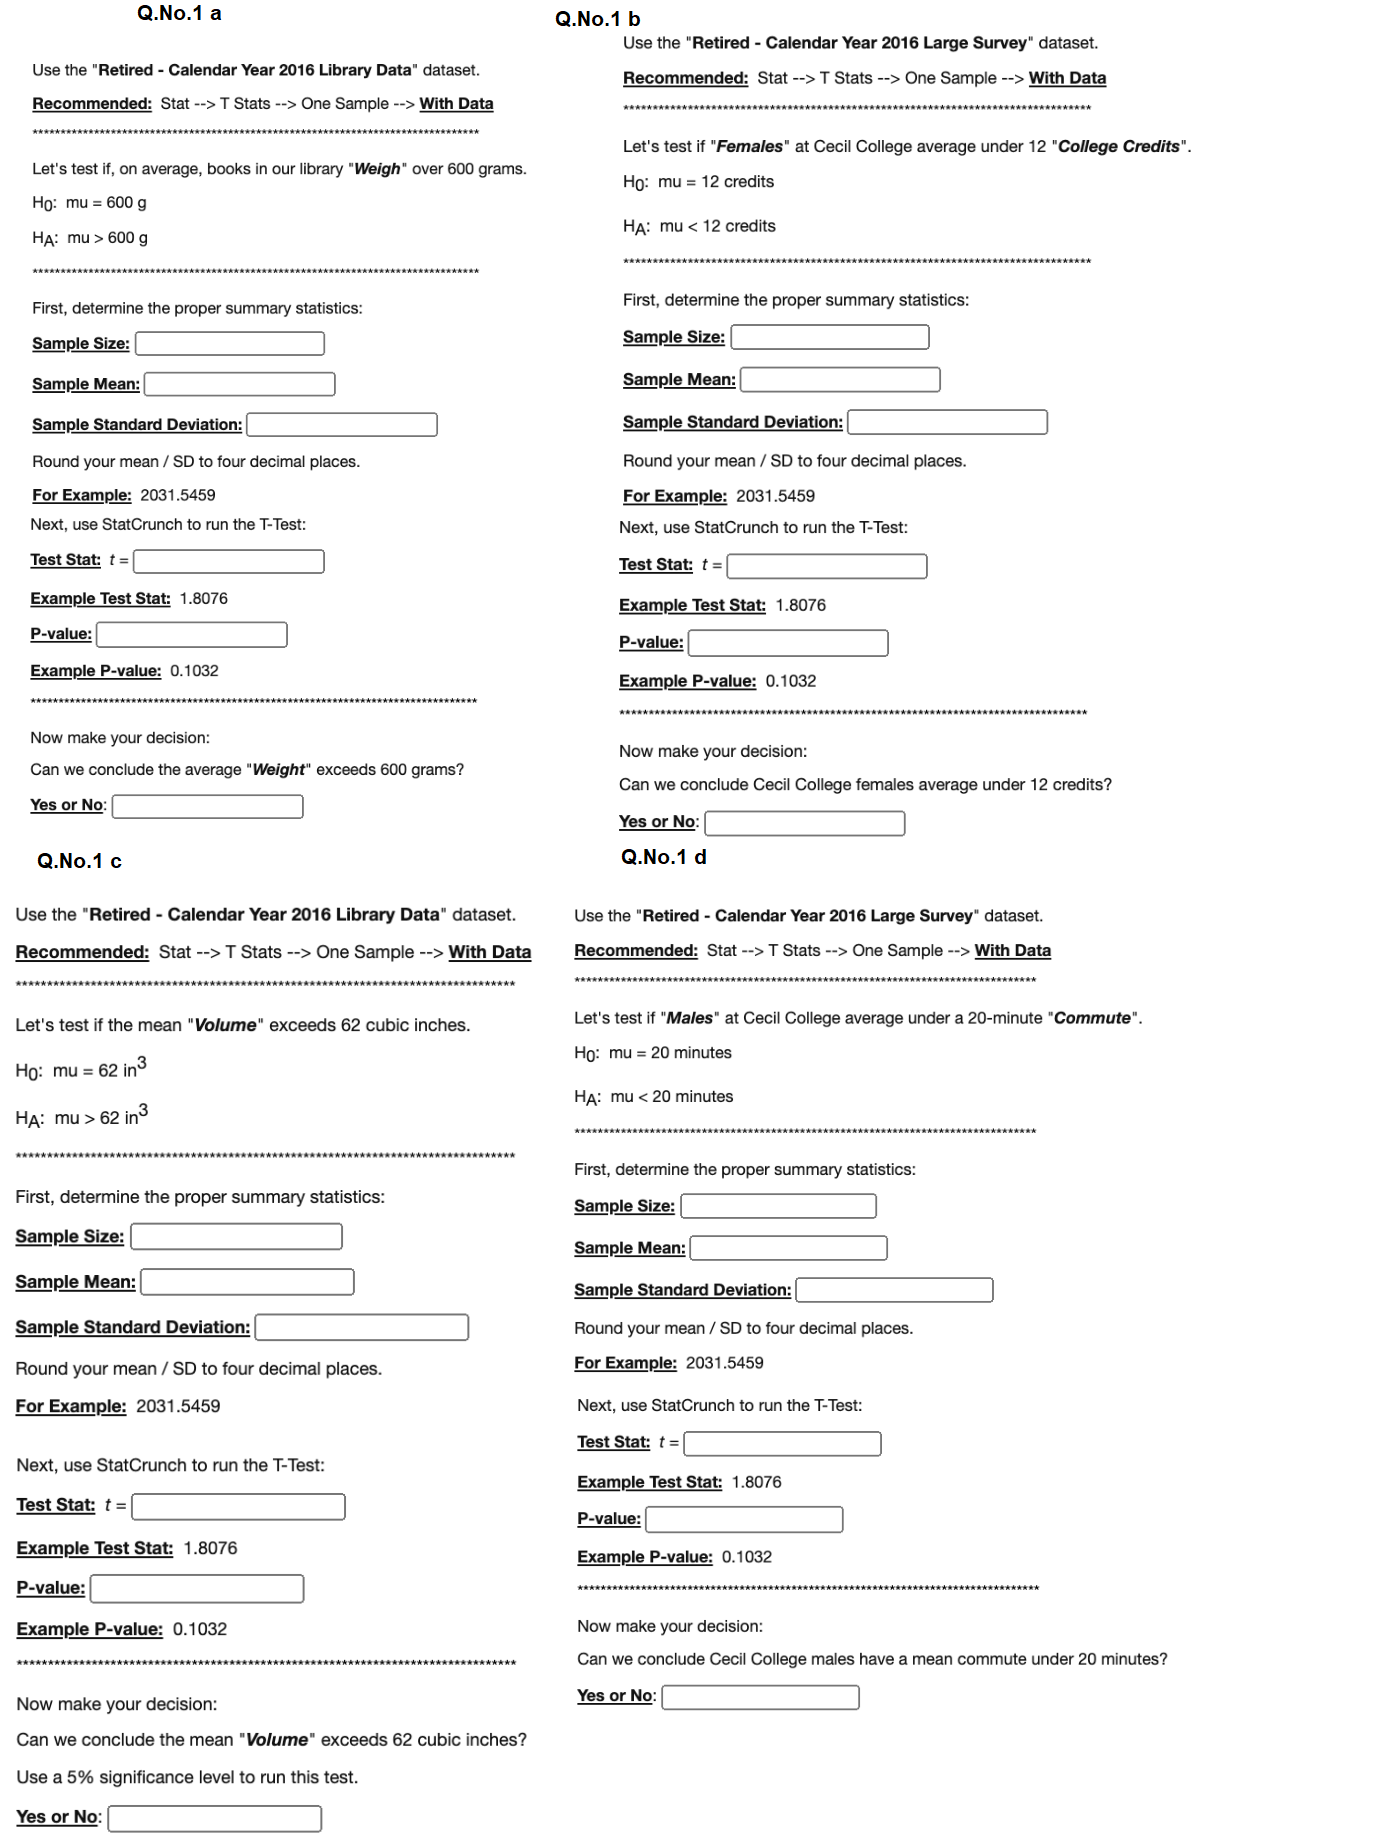
Q.No. 1 a. We had a sample size of n = 8. We had a sample size of n = 11. We had a sample size of n = 22. We had a sample size of n = 7. The P-value was 0.03 The test statistic was t = -2.0008. We had a sample mean of 10. We had a sample mean of 25. It was a lower-tailed test. It was a lower-tailed test We had a sample standard deviation of 5. We had a sample standard deviation of 5. Report the test statistic. Report the P-value. Calculate the test statistic if we are testing: Determine the P-value if we are testing: Round your answer to four decimals. Example Answer: -1.2851 Round your answer to four decimals. Ho: mu = 12 vs. HA: mu 24 Example Answer: 0.0451 Round your answer to four decimals. Round your answer to four decimals. Example Answer: 1.2851 Example Answer: 0.1559 We had a sample size of n = 25. Use the "Retired - Calendar Year 2016 Food Bank" dataset. We had a sample mean of 6. It is recommended to use (if possible): We had a sample standard deviation of 4. Stat --> T Stats -> One Sample --> With Data Determine the P-value if we are testing: Question: Ho: mu = 8 vs. HA: mu T Stats --> One Sample --> With Data It is recommended to use (if possible): Let's test if Dr. "Kingstrom's" mean "Duration" exceeds 10 years. Stat --> T Stats --> One Sample --> With Data Ho: mu = 10 years HA: mu > 10 years Question: Determine a 99% CI for the true mean "Height" for offensive tack First, determine the proper summary statistics: Sample Size: "Position" = "OT". Sample Mean: Enter the Upper Limit of the CI. Sample Standard Deviation: Round to four decimal places. Round your mean / SD to four decimal places. Example Answer: 75.6048 For Example: 2031.5459 Next, use StatCrunch to run the T-Test: Test Stat: t= Example Test Stat: 1.8076 Use the "Retired - Calendar Year 2016 Large Survey" dataset. P-value: It is recommended to use (if possible): Example P-value: 0.1032 Stat --> T Stats --> One Sample --> With Data Now make your decision: Can we conclude Dr. Kingstrom's patients average at least 10 years post-surgery? Question: Yes or No: Yes or No. Can we conclude Cecil College "Females" have at least one "Tattoo" (on average) Here is a 96% confidence interval for the population mean: Answer this question with a 99% confidence interval. (1.9090, 11.3664) Required: Determine margin of error. Yes Round your answer to four decimal places. No Example Answer: 10.9905Q.No.1 a Q.No. 1 b Use the "Retired - Calendar Year 2016 Large Survey" dataset. Use the "Retired - Calendar Year 2016 Library Data" dataset. Recommended: Stat --> T Stats --> One Sample --> With Data Recommended: Stat --> T Stats --> One Sample --> With Data Let's test if "Females" at Cecil College average under 12 "College Credits". Let's test if, on average, books in our library "Weigh" over 600 grams. Ho: mu = 12 credits Ho: mu = 600 g HA: mu > 600 g HA: mu T Stats --> One Sample --> With Data Recommended: Stat --> T Stats --> One Sample --> With Data Let's test if the mean "Volume" exceeds 62 cubic inches. Let's test if "Males" at Cecil College average under a 20-minute "Commute". Ho: mu = 62 in3 Ho: mu = 20 minutes HA: mu > 62 in3 HA: mu
Step by Step Solution
There are 3 Steps involved in it

Get step-by-step solutions from verified subject matter experts