

Question: Hi there, could you help me solve these problems? Also could you show me the R codes for each question? Thank you! 1) The table
Hi there, could you help me solve these problems? Also could you show me the R codes for each question? Thank you!
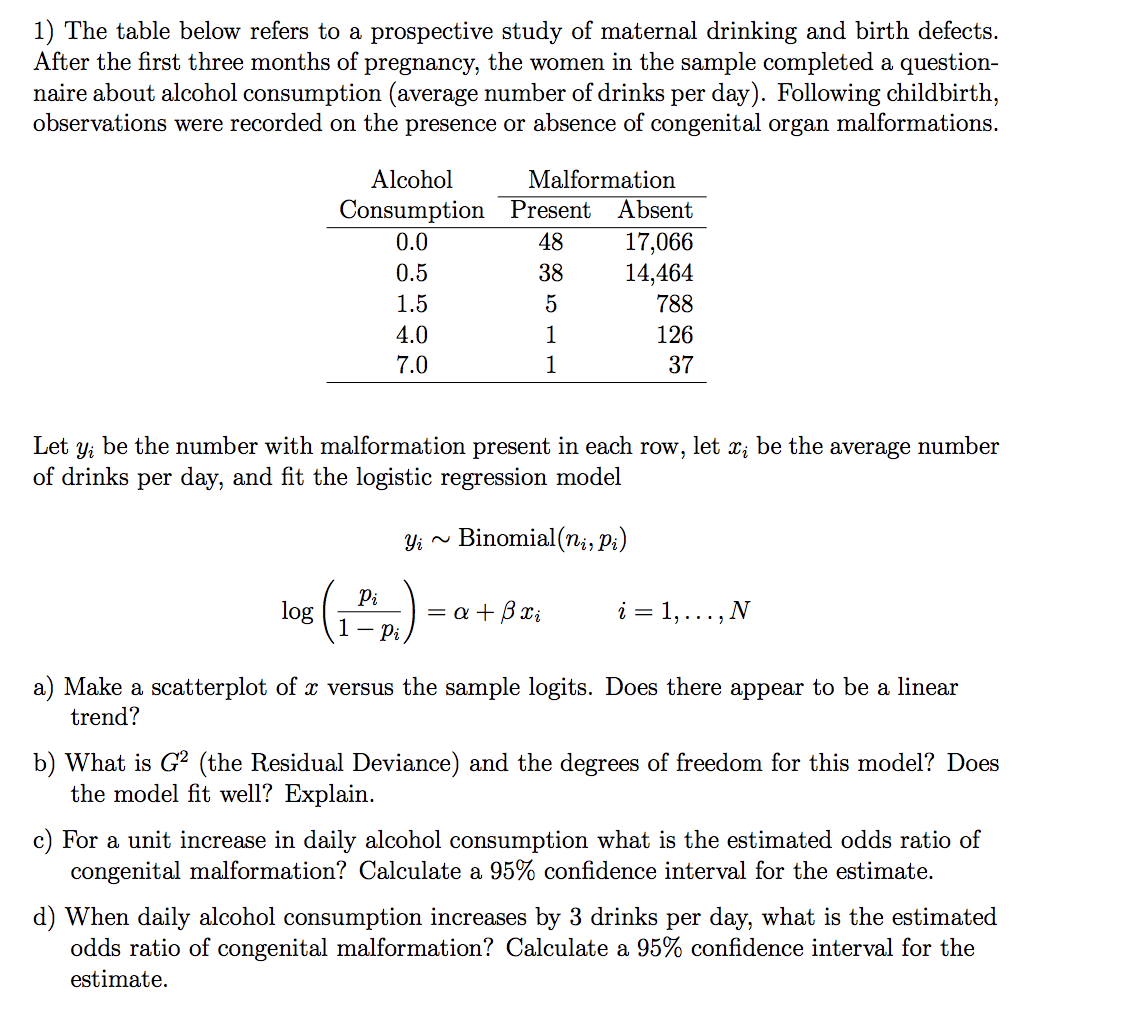
1) The table below refers to a prospective study of maternal drinking and birth defects. After the rst three months of pregnancy, the women in the sample completed a question- naire about alcohol consumption (average number of drinks per day). Following childbirth, observations were recorded on the presence or absence of congenital organ malformations. Alcohol Malformation Consumption Present Absent 0.0 48 17, 066 0.5 38 14,464 1.5 5 788 4.0 1 126 7.0 1 37 Let y; be the number with malformation present in each row, let 33.; be the average number of drinks per day, and t the logistic regression model 91- ~ Binomial(n,-, pi) a) Make a scatterplot of 2: versus the sample logits. Does there appear to be a linear trend? b) What is G2 (the Residual Deviance) and the degrees of freedom for this model? Does the model t well? Explain. c) For a unit increase in daily alcohol consumption what is the estimated odds ratio of congenital malformation? Calculate a 95% condence interval for the estimate. d) When daily alcohol consumption increases by 3 drinks per day, what is the estimated odds ratio of congenital malformation? Calculate a 95% condence interval for the estimate
Step by Step Solution
There are 3 Steps involved in it

Get step-by-step solutions from verified subject matter experts