

Question: Hi there - Could you please help me understand how to graph this? Also what is being asked when they say Compute the values of
Hi there - Could you please help me understand how to graph this? Also what is being asked when they say "Compute the values of Consumer Surplus (CS1) and Producer Surplus (PS1), clearly indicating the units that CS and PS are measured in". Your help is greatly appreciated - thank you!
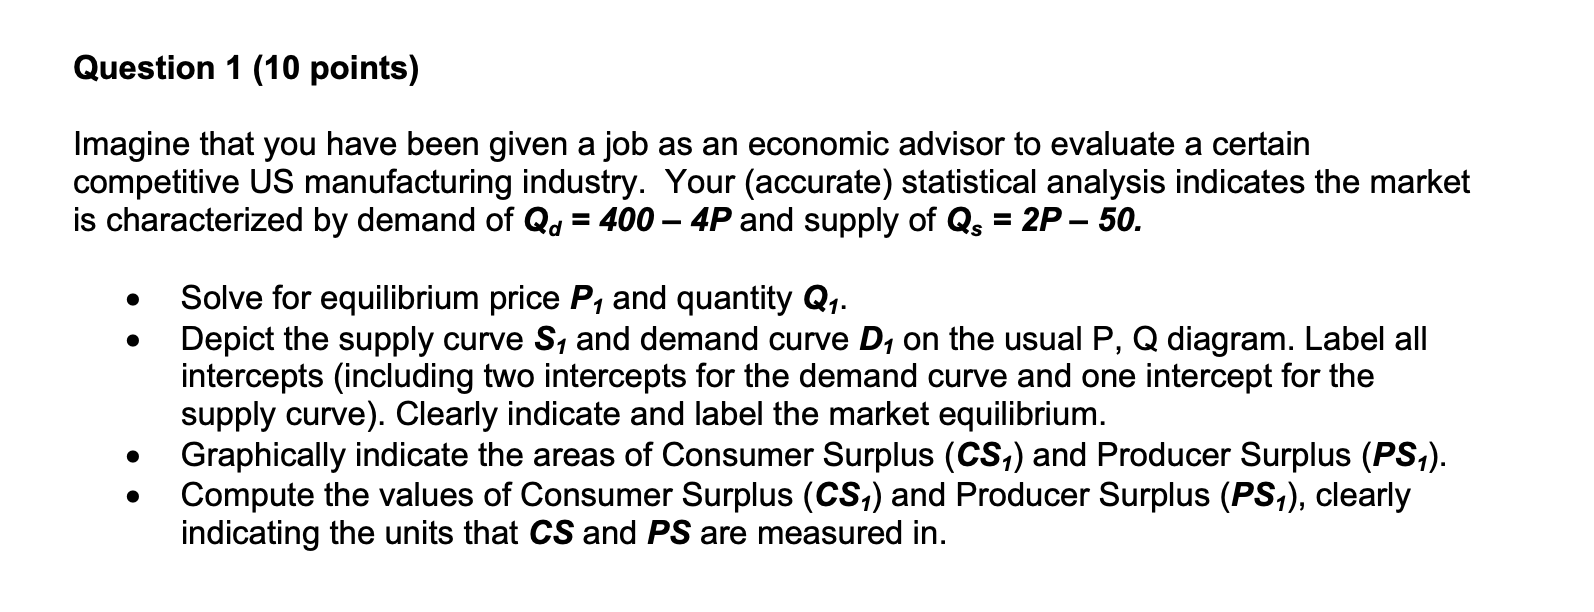
Question 1 (10 points) Imagine that you have been given a job as an economic advisor to evaluate a certain competitive US manufacturing industry. Your (accurate) statistical analysis indicates the market is characterized by demand of 0., = 400 4F and supply of as = 2P 50. Solve for equilibrium price P1 and quantity 0,. Depict the supply curve 81 and demand curve D, on the usual P, Q diagram. Label all intercepts (including two intercepts for the demand curve and one intercept for the supply curve). Clearly indicate and label the market equilibrium. Graphically indicate the areas of Consumer Surplus (CS1) and Producer Surplus (P81). Compute the values of Consumer Surplus (C81) and Producer Surplus (P8,), clearly indicating the units that CS and P8 are measured in
Step by Step Solution
There are 3 Steps involved in it

Get step-by-step solutions from verified subject matter experts